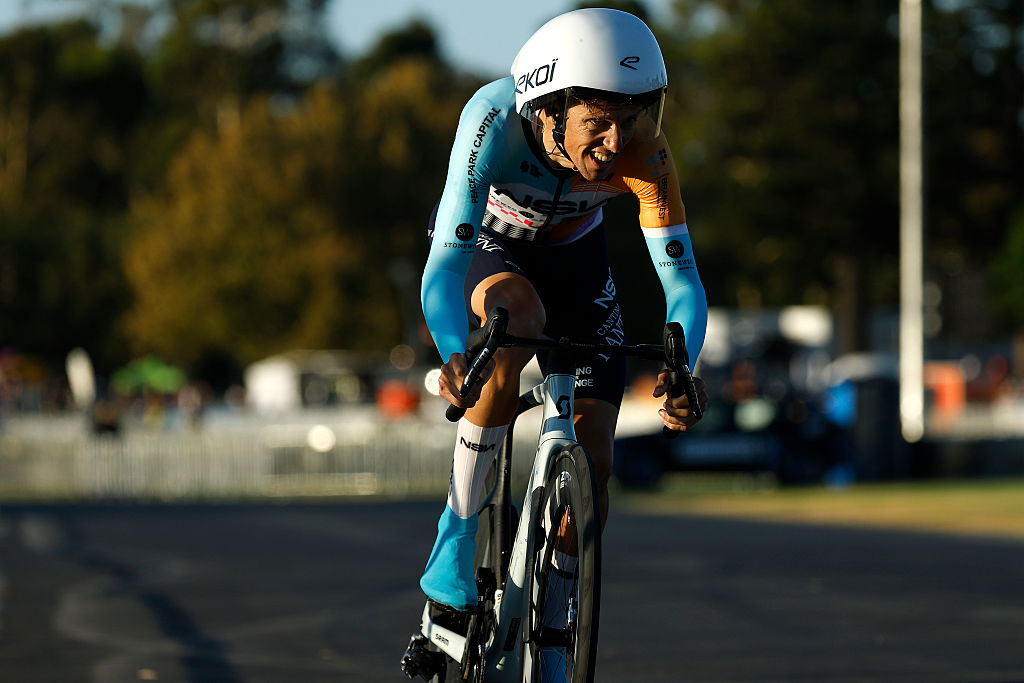
We took 16 pairs of aero socks to the wind tunnel to find which was fastest, and we're still shocked by the results
From Assos and AeroCyclingGear to NoPinz, Rule2, Sockeloen and Velotoze, we tested all the best aero socks on the market to find out whether all aero socks are created equal
The latest race content, interviews, features, reviews and expert buying guides, direct to your inbox!
You are now subscribed
Your newsletter sign-up was successful
I think it's safe to say that aerodynamics has become priority number one for most competitive cyclists when buying new equipment.
From wheels and frames, to helmets, clothes and more, there's rarely a new product released without some mention of being more aerodynamic than a competitor or a predecessor.
And since bike races can be won and lost by a fraction of a second, the promise of 'free' speed is hard to ignore. That's especially true at the professional level, where careers can be helped or hindered by the finest of margins.
But while most 'aero' products have been adopted with relatively open arms, there's one that took a little longer to pass the fashion test: Aero socks.
The traditional cyclists shunned them as a gimmick with no real-world benefit, dubbing them a marginal gain too far, or a symbol of trying too hard. But more progressive racers such as Dan Bigham and Alex Dowsett proved that they offered a tangible benefit.
Assuming you could prevent them from falling down – easier said than done with some brands in the early days of aero socks – Bigham regularly boasted a saving of "seven-to-ten watts."
Nowadays, the entire peloton wears them, and although the best cycling socks for everyday riders are still mostly without an aero claim, you'll find many amateurs wearing them too.
I recently heard someone say that "if the entire peloton is wearing aero socks, then nobody's wearing aero socks." Of course, that's not to be taken literally, but it poses a question: if the entire peloton is wearing aero socks, is anybody actually gaining an advantage? Or are they all created equal?
If swapping helmets can save you around 12 watts, and there's 6 watts between two high-end wheelsets, then surely there's a difference between a nominally 'good' and 'bad' pair of aero socks?
Should we all be spending fifty pounds/dollars/euros (delete as appropriate) on a pair of socks, or can we just head to Amazon to buy a pair for as cheap as we can find?
We headed to a wind tunnel to find out.
The test and protocols
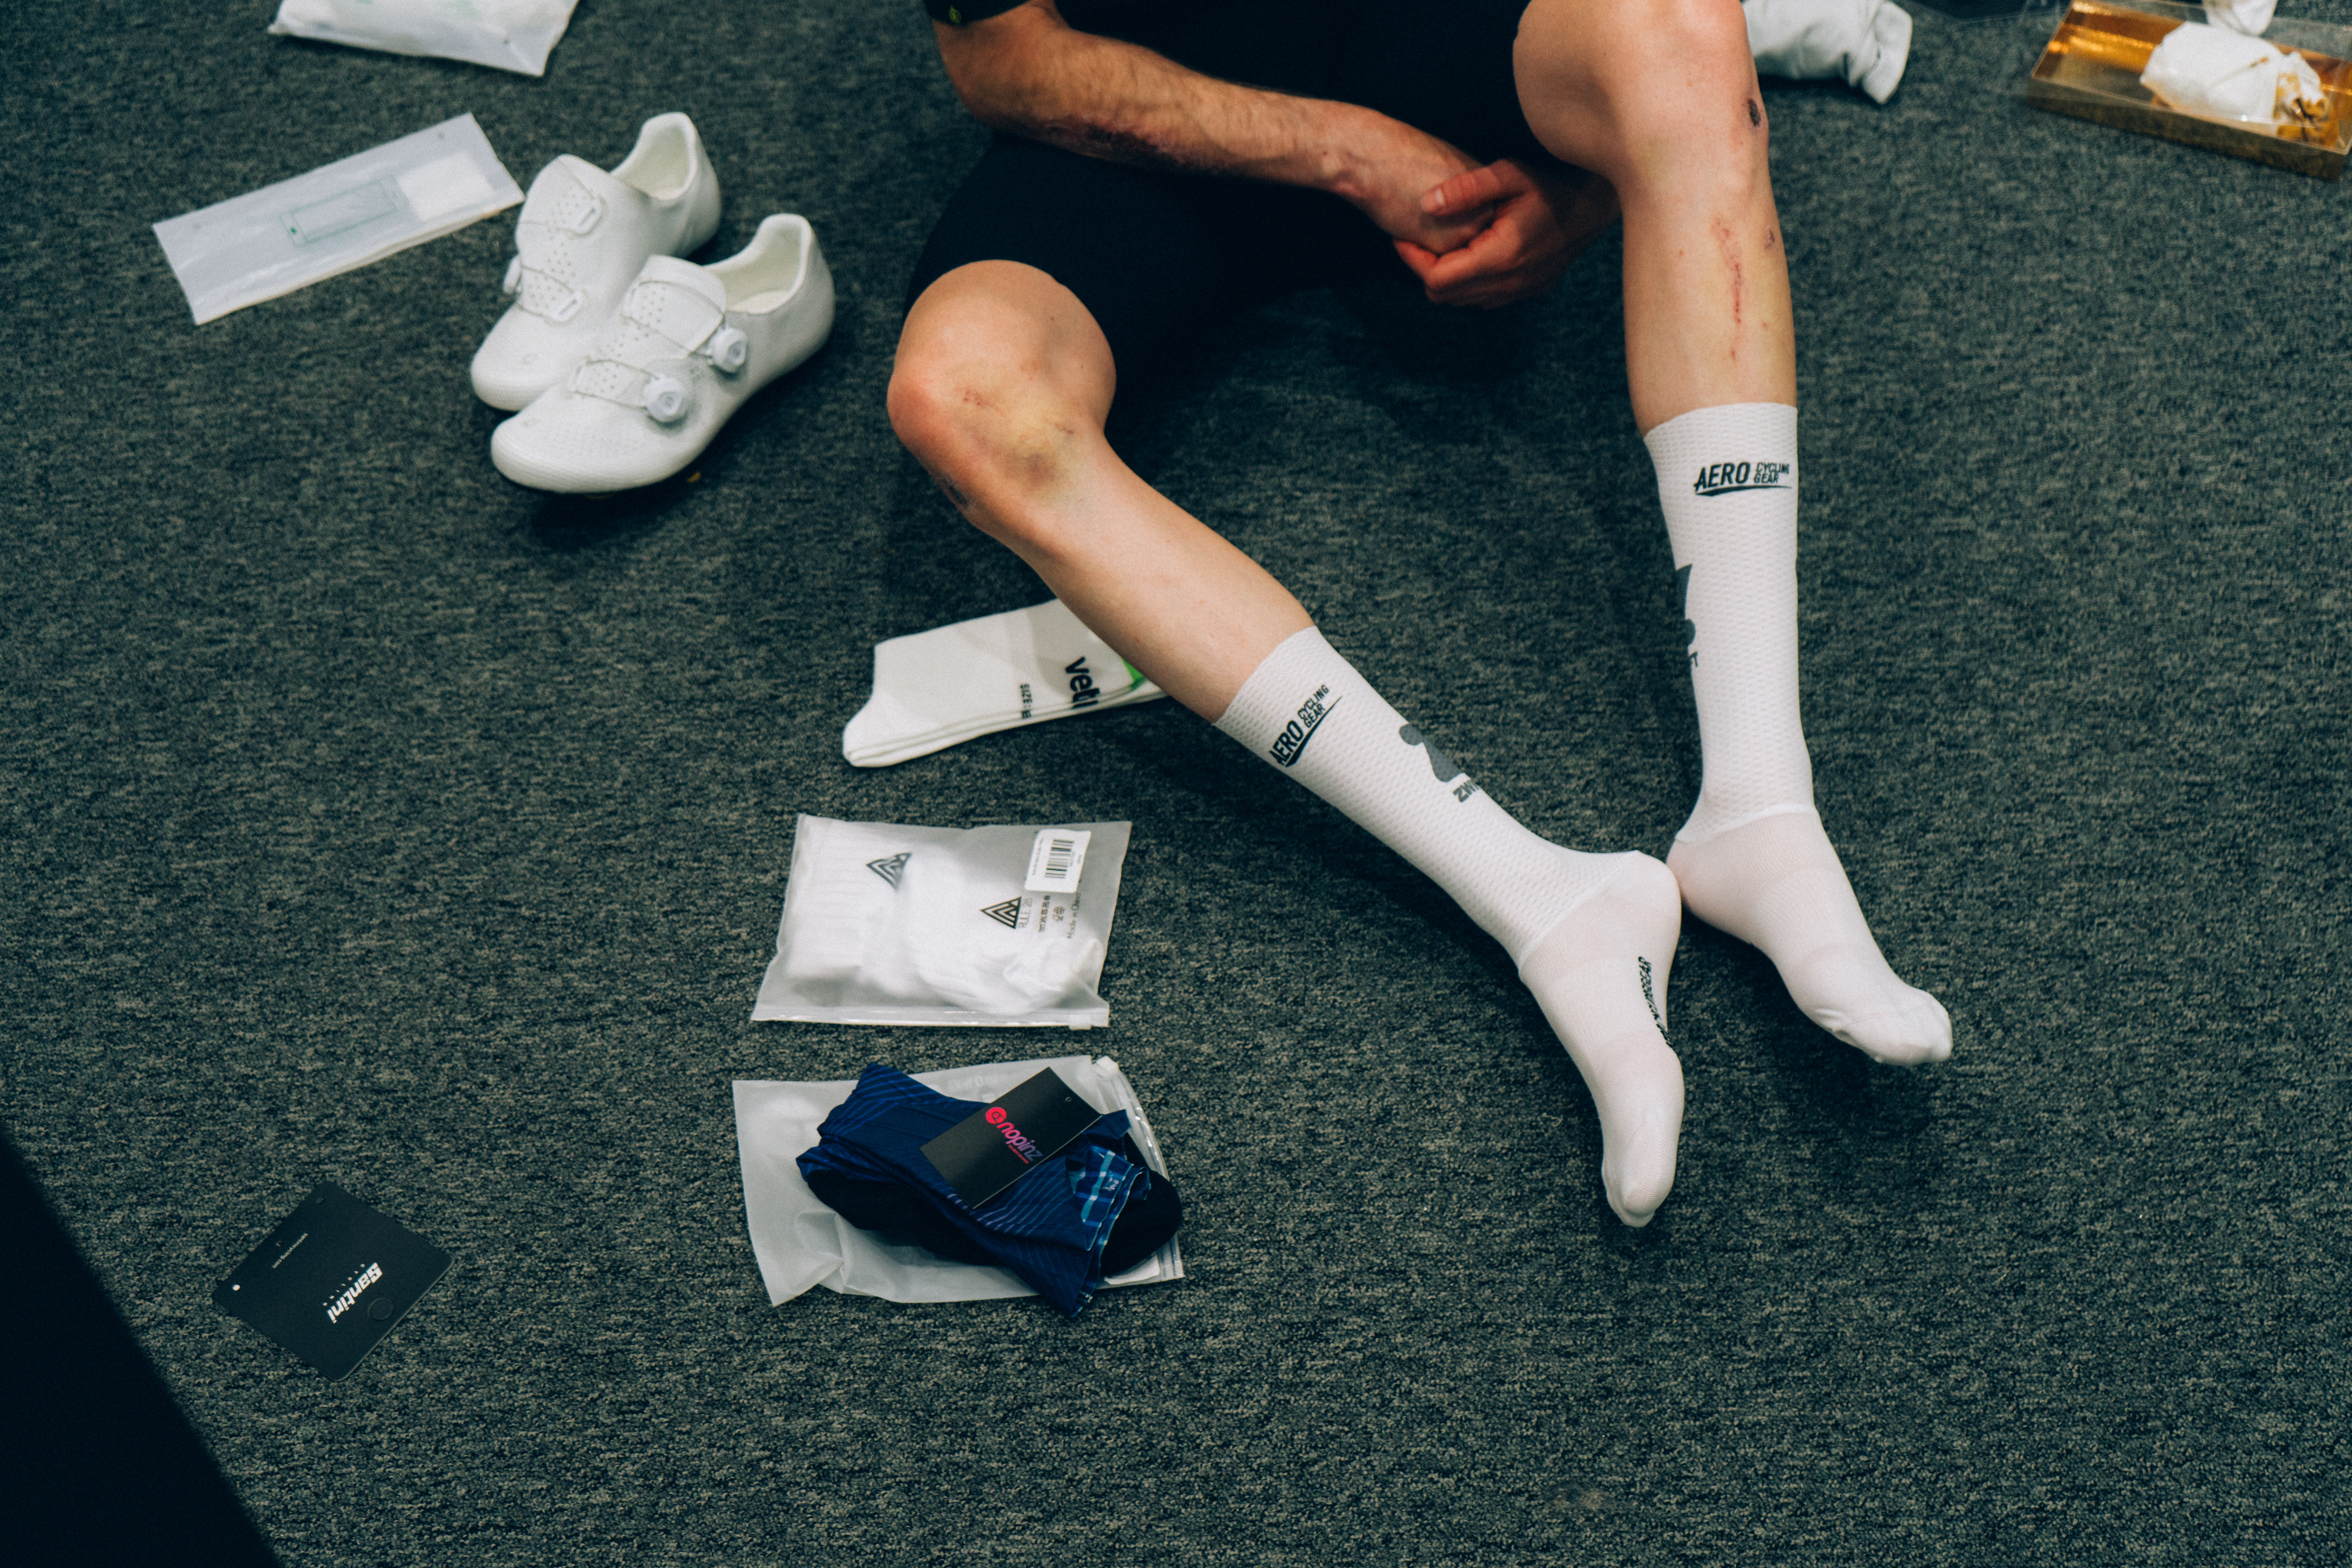
Our test comprised 16 pairs of nominally 'aero' socks from a mixture of unknown and well-known brands such as Bioracer, Assos, Sockeloen, Rule 28, and so on. We also had two pairs of nominally 'non-aero' socks from Bontrager and Swiftwick, and a final test with no socks at all.
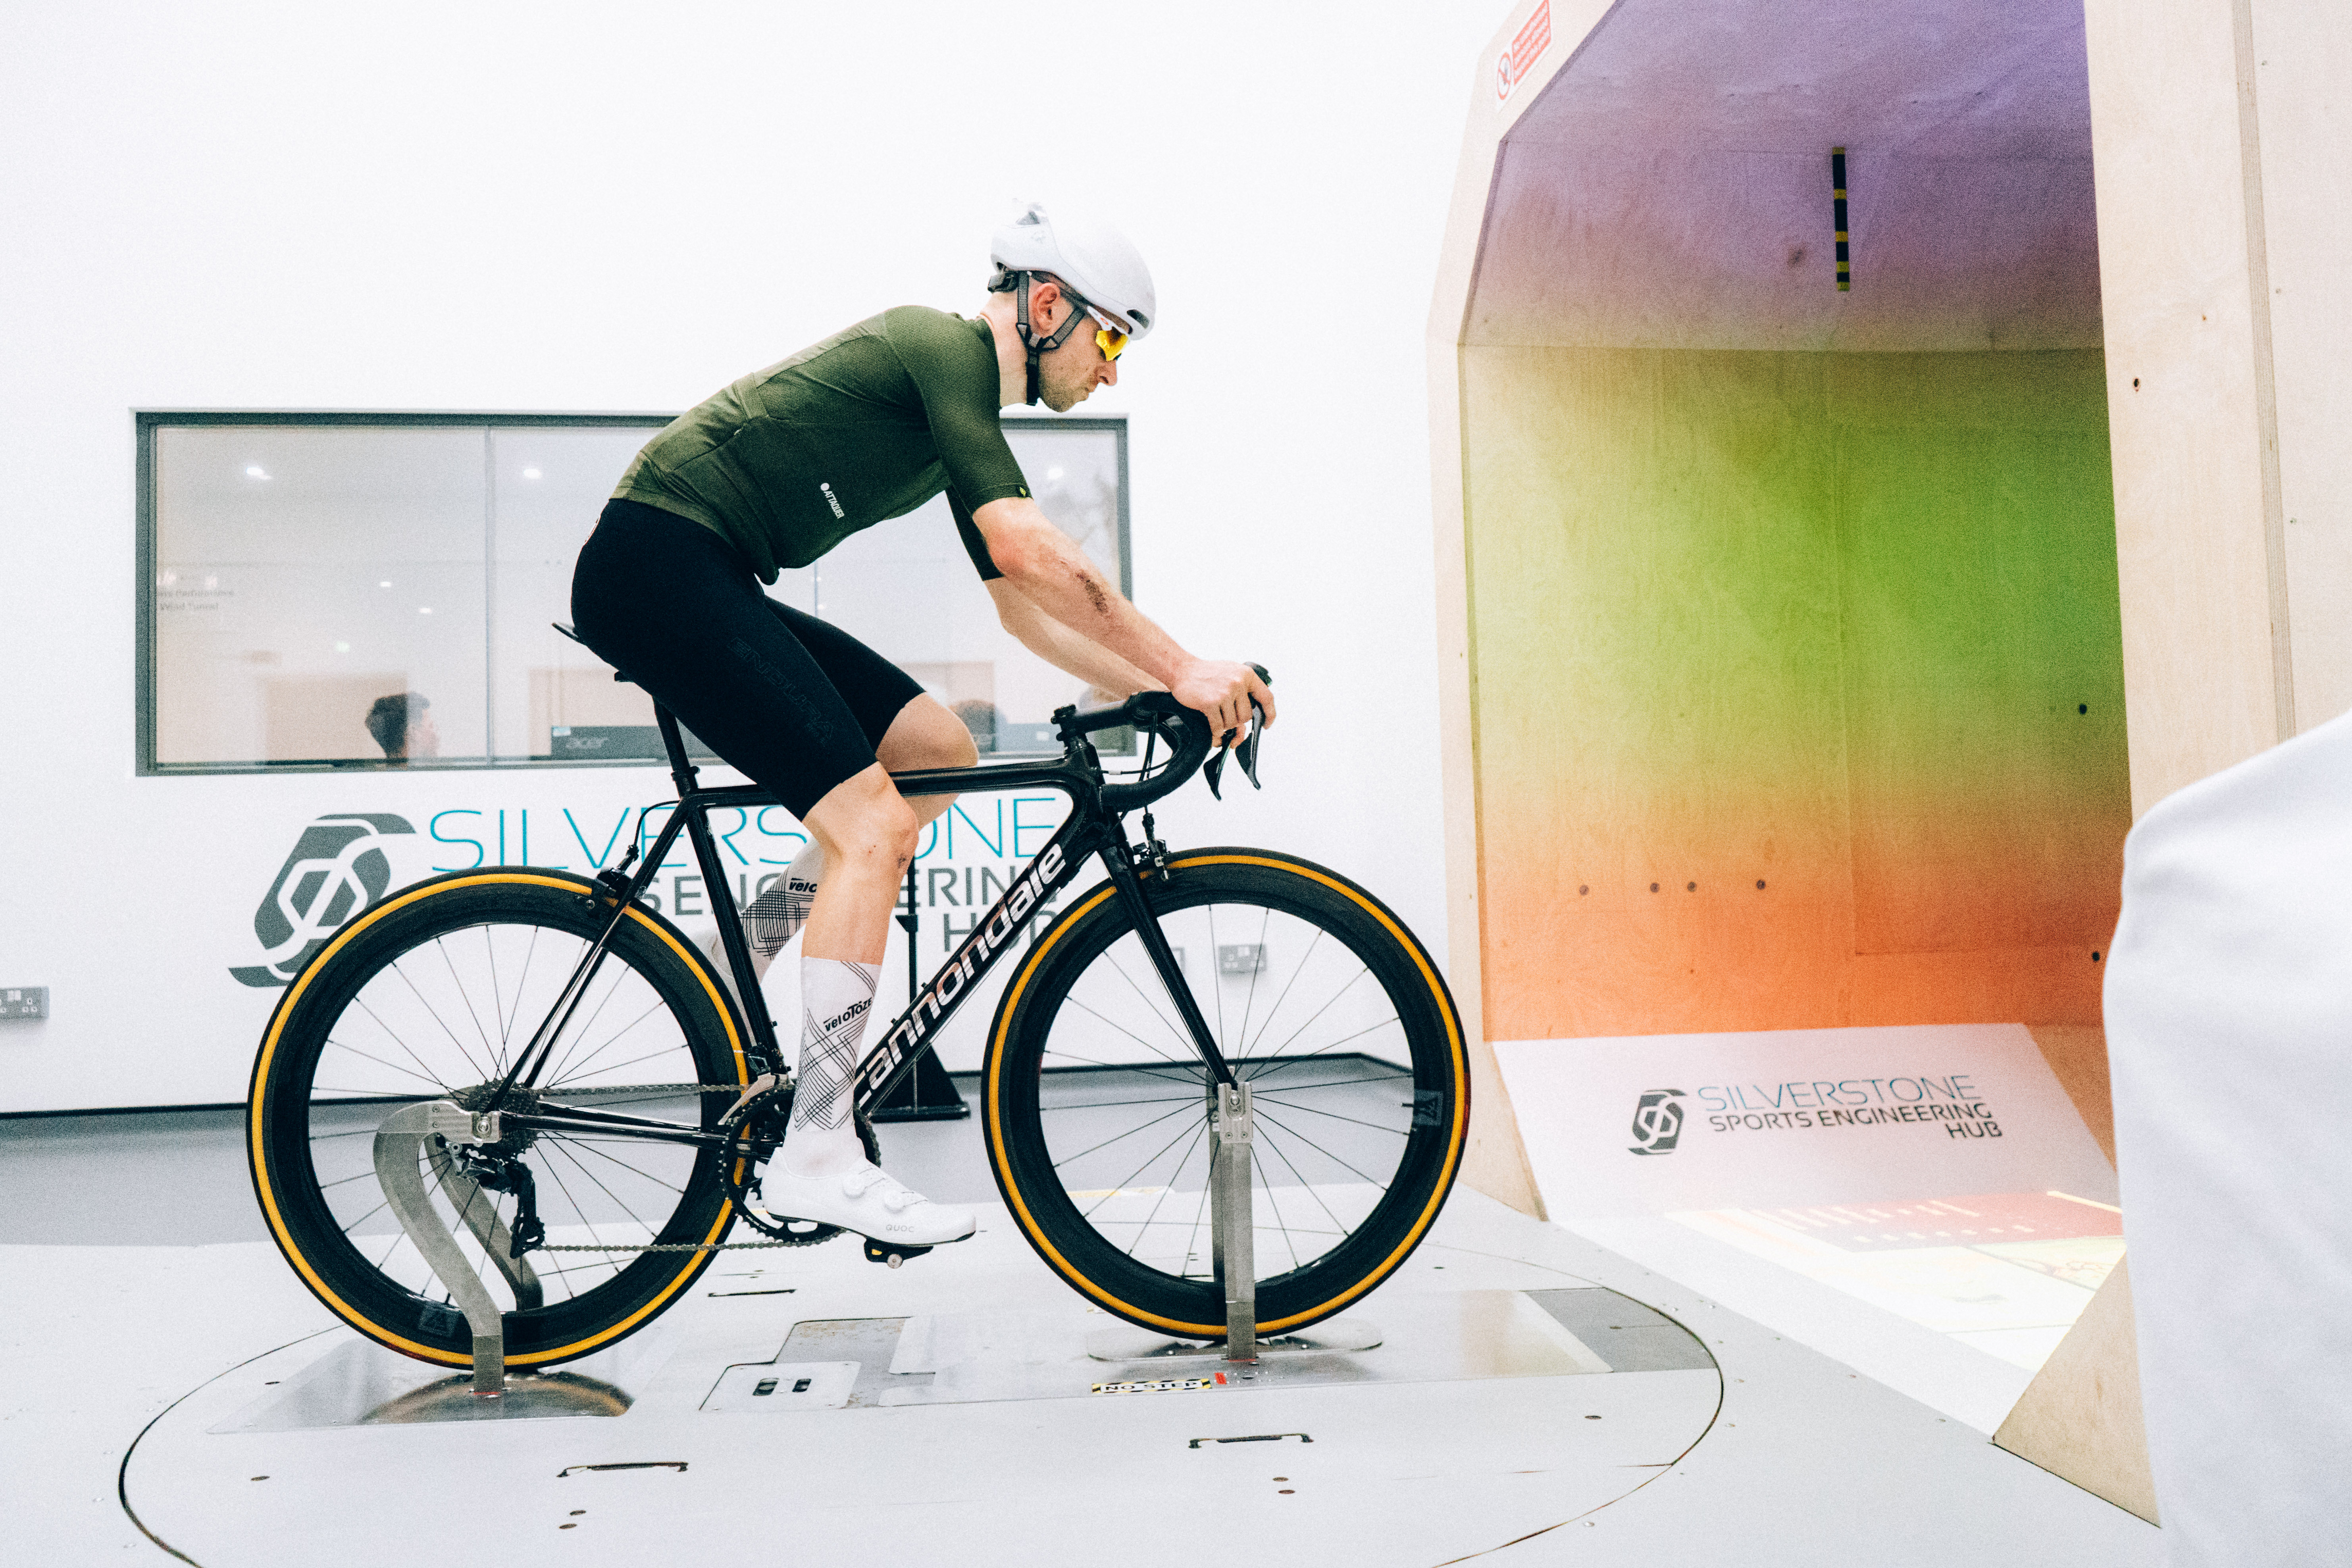
As ever, our test was performed at the Silverstone Sports Engineering Hub. Wind speed was set at 45km/h (27.96mph), and the rider on the bike was our esteemed tech writer, Tom Wieckowski.
The wind tunnel measures CdA (Coefficient of Drag x Area). Measured in M², this quantifies how easily something passes through the air. This was captured at three different yaw angles: -5°, 0°, and +5°. This is the angle at which the wind hits the rider, and although we could have stopped at zero – a direct headwind – since most people are largely symmetrical, we opted to test both sides to be more confident in the data we were seeing.
Each capture was held for 30 seconds. The longer the capture, generally, the more accurate the data, but with the caveat that the rider needs to hold as steady a position as possible. Thirty seconds is a good sweetspot between the inaccurate data of short captures and the added fatigue and discomfort of longer captures.
When calculating the power required, I have weighted the CdA as outlined in the research by Nathan Barry et al., titled "A New Method for Analysing the Effect of Environmental Wind on Real-World Aerodynamic Performance in Cycling." Since we spend more time at 0° yaw than we do at 5° or -5°, this weighting increases the value of the 0° angle in line with real-world conditions.
I have then calculated using the following equation, where Air Density is set at 1.2 kg/m3 and Velocity is 12.5 m/s (45km/h).
Power (watts) = 0.5 x AirDensity x CdA x Velocity^3
Assuming the same air density, a lower CdA means less power is required to ride the same speed, so a lower CdA is better.
Standardisations
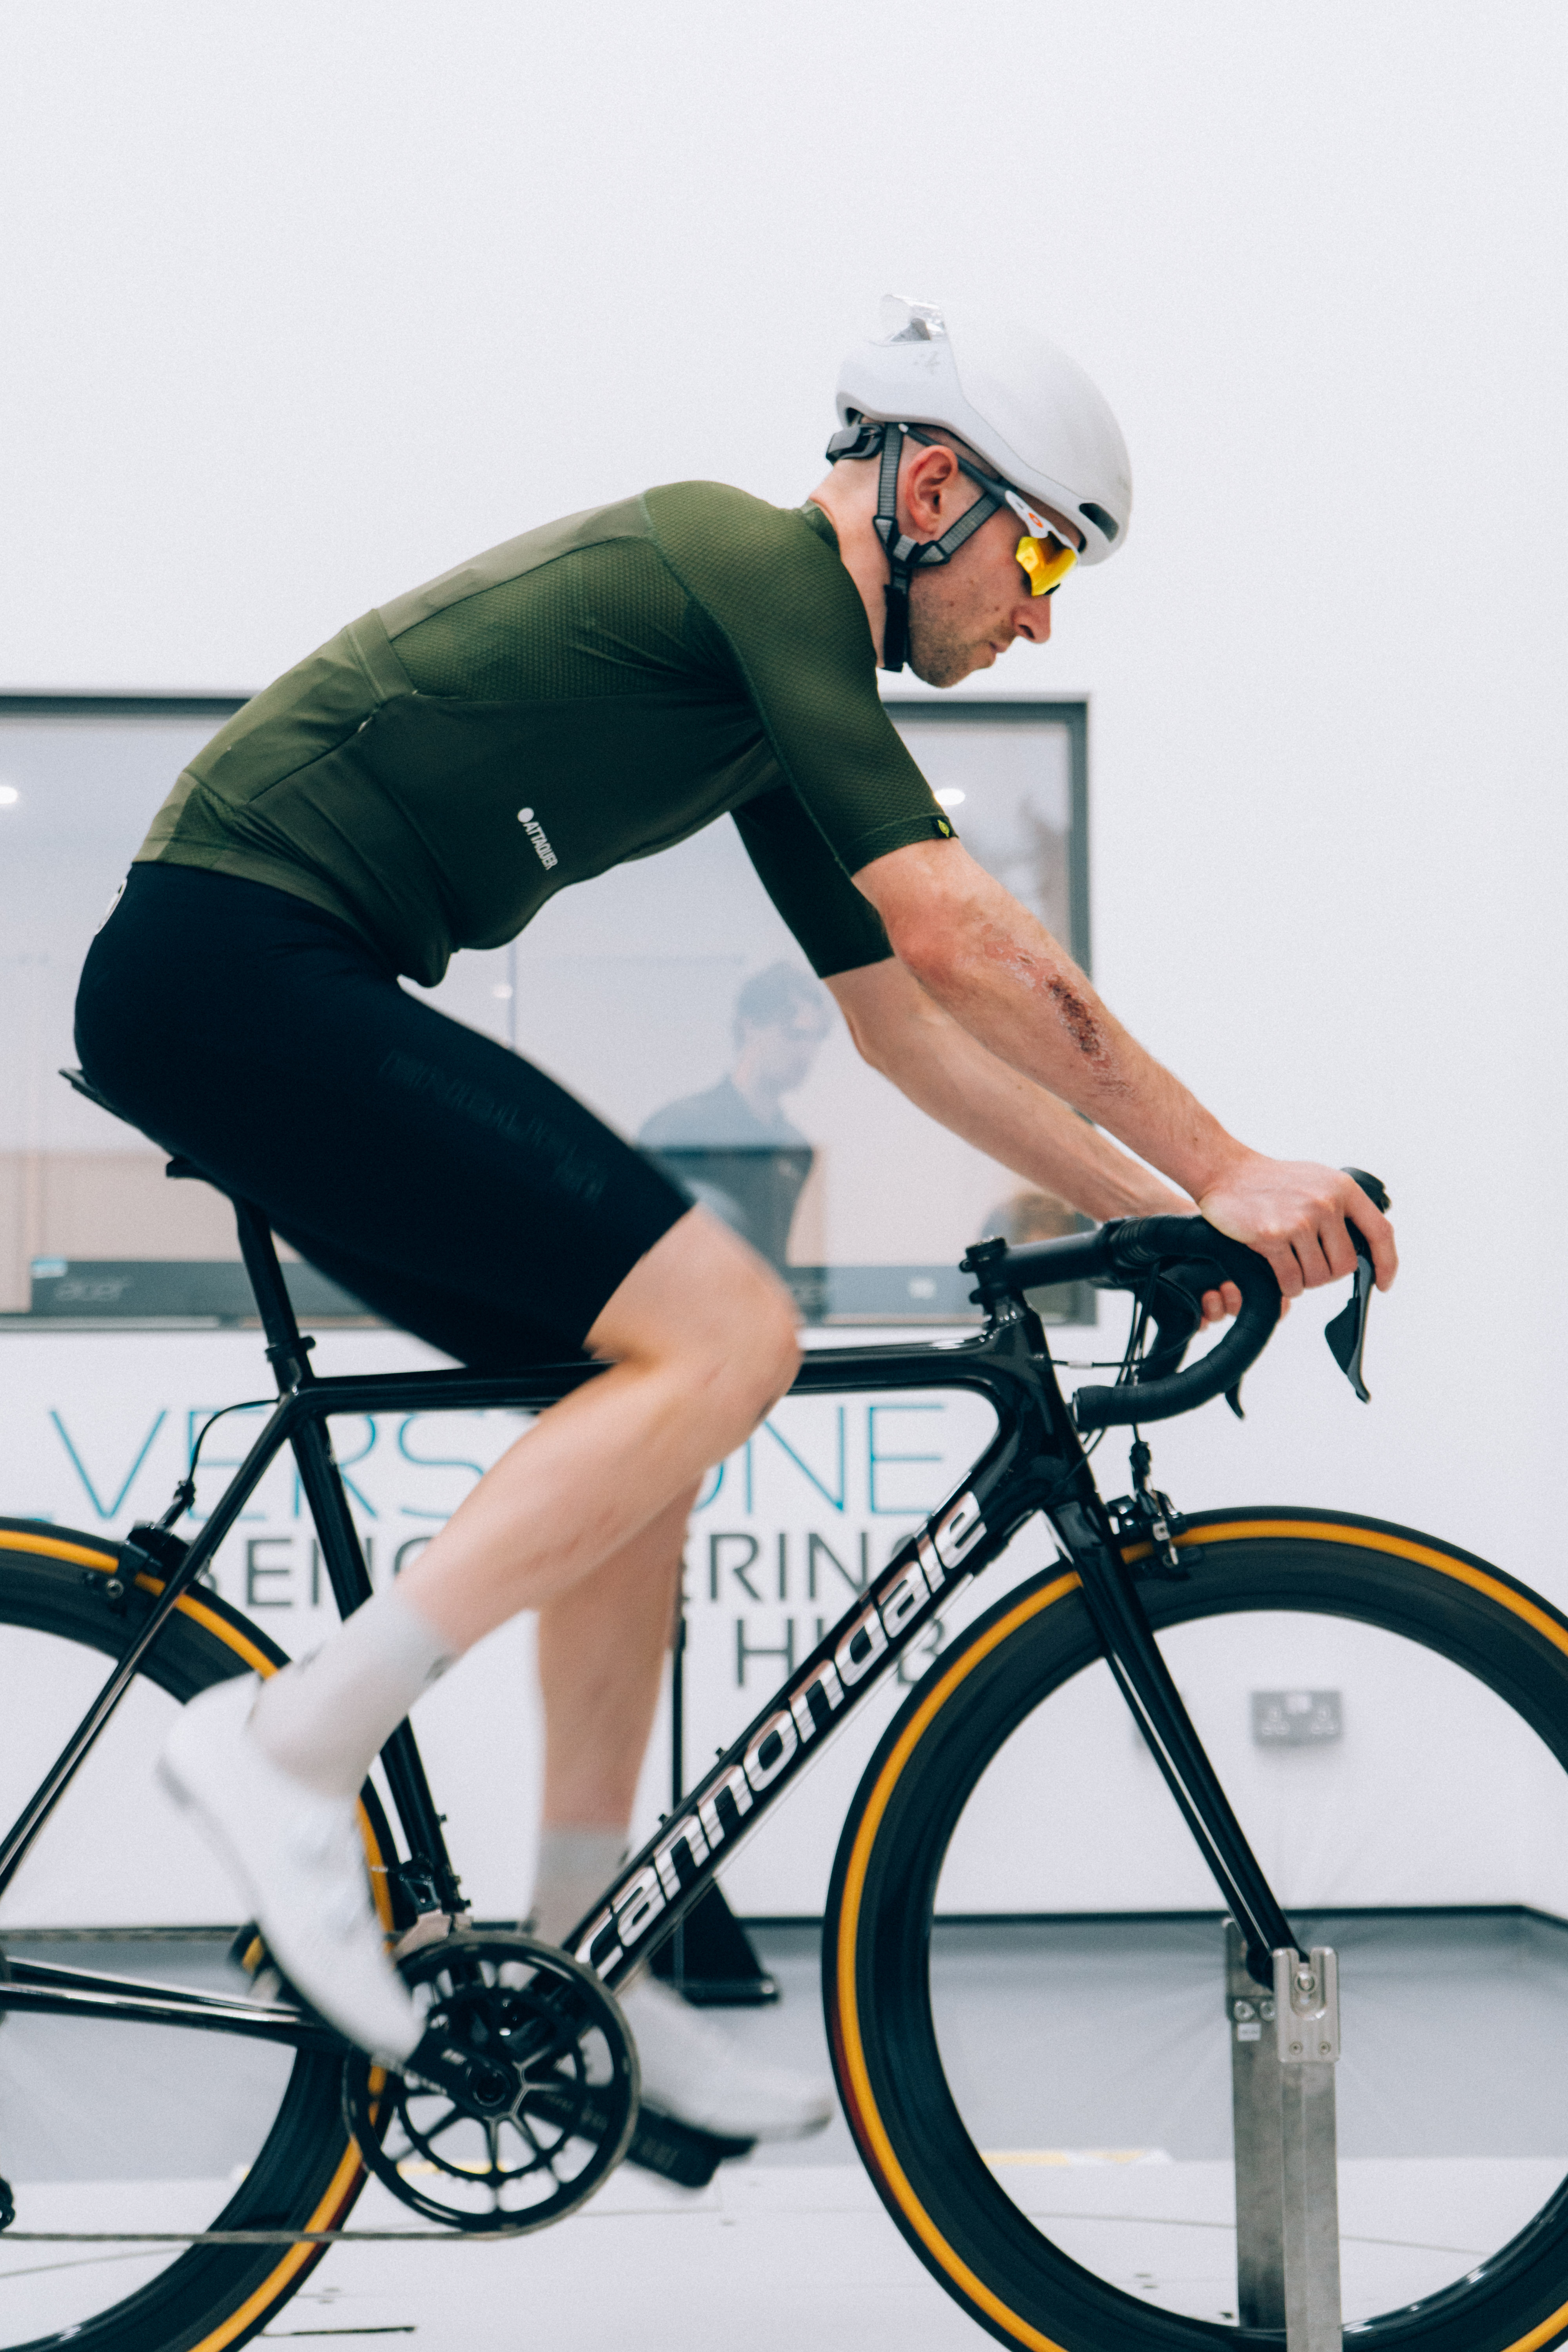
For each test, everything except for the socks was kept the same, meaning the bike, the rider, cadence, position, other kit, and test protocols remained unchanged throughout.
The wind tunnel was tared prior to each test, similar in principle to the tare on your kitchen scales or zero-offsetting your power meter to ensure accurate readings.
The bike in question was Tom's own Cannondale SuperSix Evo Hi Mod. His position on the bike was captured during the first test, and then projected to the floor for subsequent tests to help him recreate it.
Confidence margin
Our confidence margin for our results is +/- 0.0028 M² CdA, or 3.24 watts (at the tested 45km/h speed).
This was calculated by performing a baseline test at the start of the day, an immediate repeat, a mid-day repeat, then a final repeat at the end of the day, all using the same pair of socks (the non-aero Bontrager socks). We then averaged the three yaw angles for each test and found the biggest difference.
The purpose of finding this confidence margin is to account for what errors can creep into our testing protocol. By seeing a maximum 0.0028 M² difference despite making no changes, we must assume that all other measurements are subject to an equal error, even if the reality is that most will fall somewhere within.
There was no obvious trend from the start of the day to the end of the day, so the reason for the variance is most likely due to Tom's position on the bike changing very slightly from test to test. The 0.0028M² error is roughly the same as we've seen in previous tests.
Since we have multiple results for the Bontrager socks, I have averaged those when comparing against the others.

Results
I'll start with our baseline nominally-non-aero socks. This is a 10-year-old pair of Bontrager four-inch polyester socks, with very little in the way of aero claims. We tested this pair four times, so the figure below is the average of the results we found.
The average weighted CdA is 0.3433M², which equates to a power of 402.3 watts at 45km/h. (Remember that this, and all other power figures below, is subject to a +/-3.24w error). At 250 watts (ignoring other losses such as friction and rolling resistance), this would equate to a speed of 38.4km/h, meaning a 40km time trial would be completed in 1h 2m 30s.
And now, in alphabetical order, let's run through the various socks on test.
For each product, I have reported on the following metrics. Here's a quick explainer on what they mean:
Average Weighted CdA: I took the CdA figure that comes out of the wind tunnel for each of the three yaw angles we tested, weighted the yaw angles per Barry 2018 as outlined above, and then averaged these to generate a weighted average. The lower the number, the better.
Watts at 45km/h: Using the weighted CdA, I've calculated the power required to propel the bike at 45km/h. The lower the better, but be aware this doesn't account for other losses like rolling resistance or drivetrain friction.
Speed at 250 watts: Again, ignoring other losses, if you pedalled a bike at 250 watts wearing each pair of socks on test, this is the speed you could expect to see. In this case, the faster you go, the better.
Distance gained vs baseline: If we pedalled a bike at 250 watts for 60 minutes, we can work out how far we'd travel. This metric compares each pair of aero socks against the Bontrager 'baseline' sock. Positive numbers mean you'd travel further, and thus bigger numbers are better. Negative numbers mean the Bontrager sock is faster.
Time to cover 40km: Again, pedalling at 250 watts, how long would it take before you've successfully covered 40km. The less time, the better.
Time saved vs slowest: Since the Bontrager baseline socks aren't the slowest on test, I made a separate comparison against the slowest product on test. In this case, that honour went to Huub, but our error margin shows that any product in the bottom half of the table could end up bottom on a different day. This shows how much sooner you'd finish your 40km time trial, just by wearing a different pair of socks.
It also helps us to answer the question at the very beginning, which asked whether all aero socks are equal, or whether there's a difference between different models.
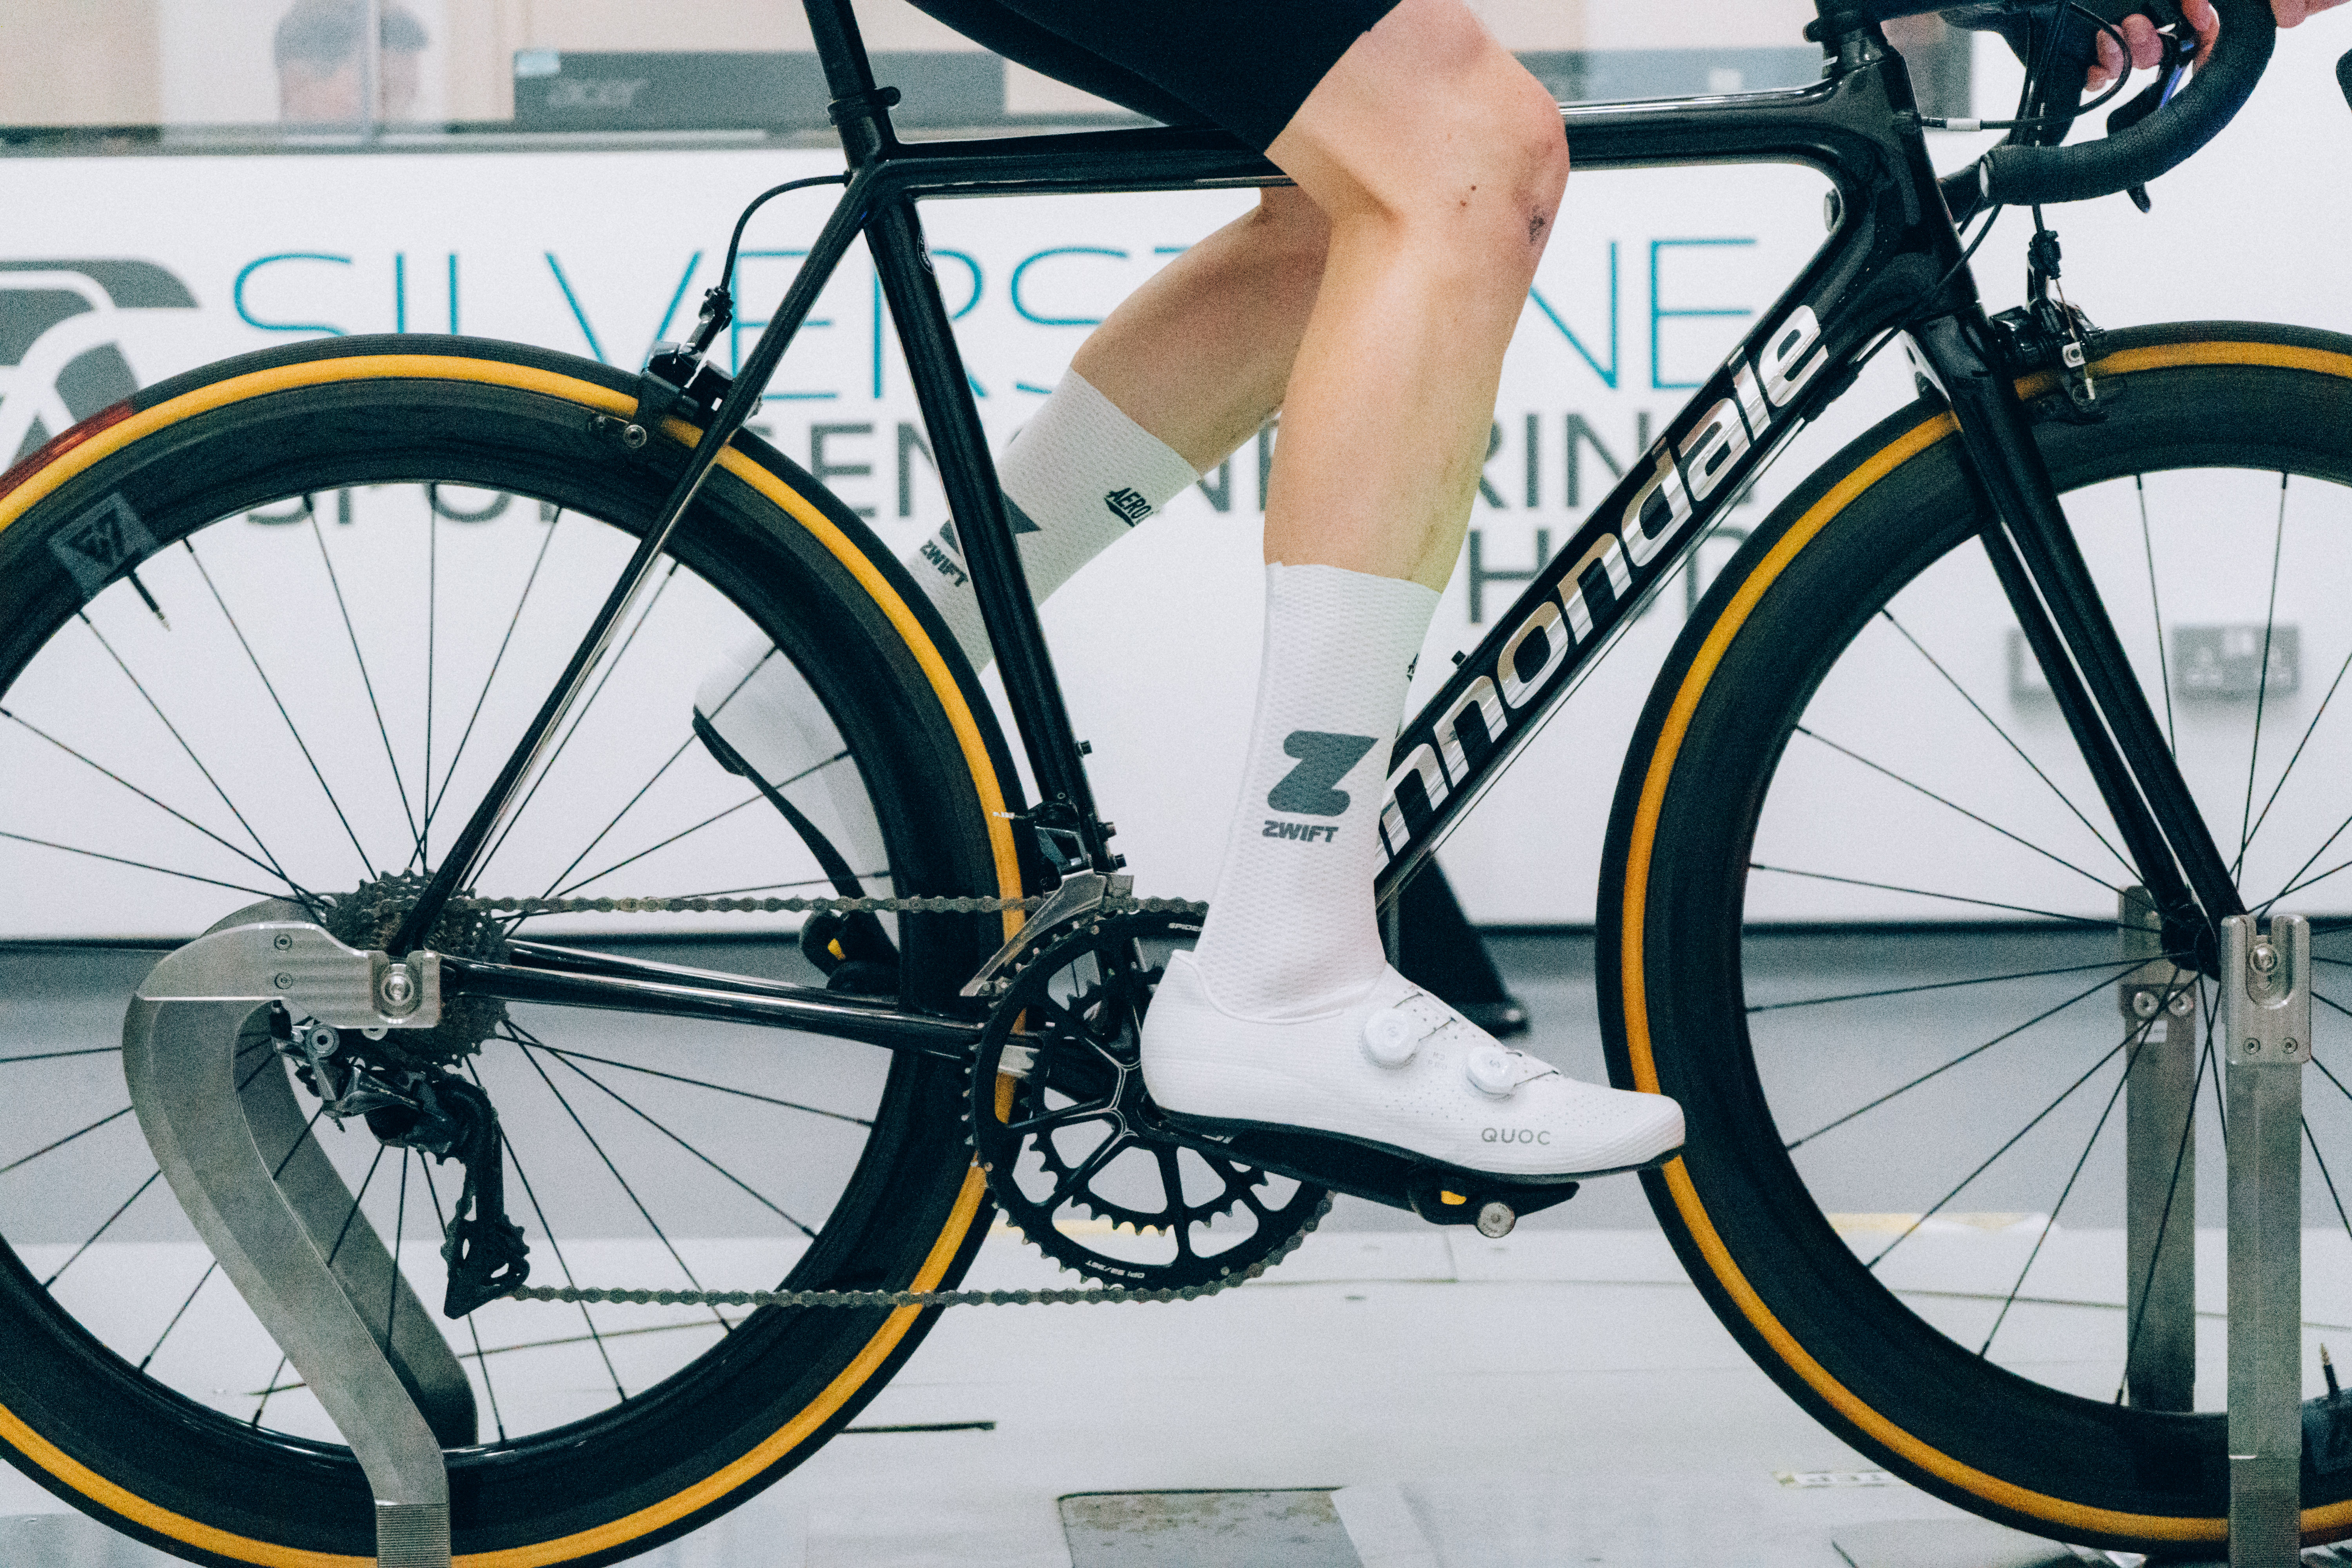
Average Weighted CdA: 0.3447M²
Watts at 45km/h: 403.91
Speed at 250 watts: 38.350km/h
Distance gained vs baseline: -51.3m
Time to cover 40km: 01h 02m 35s
Time saved vs slowest: 18s
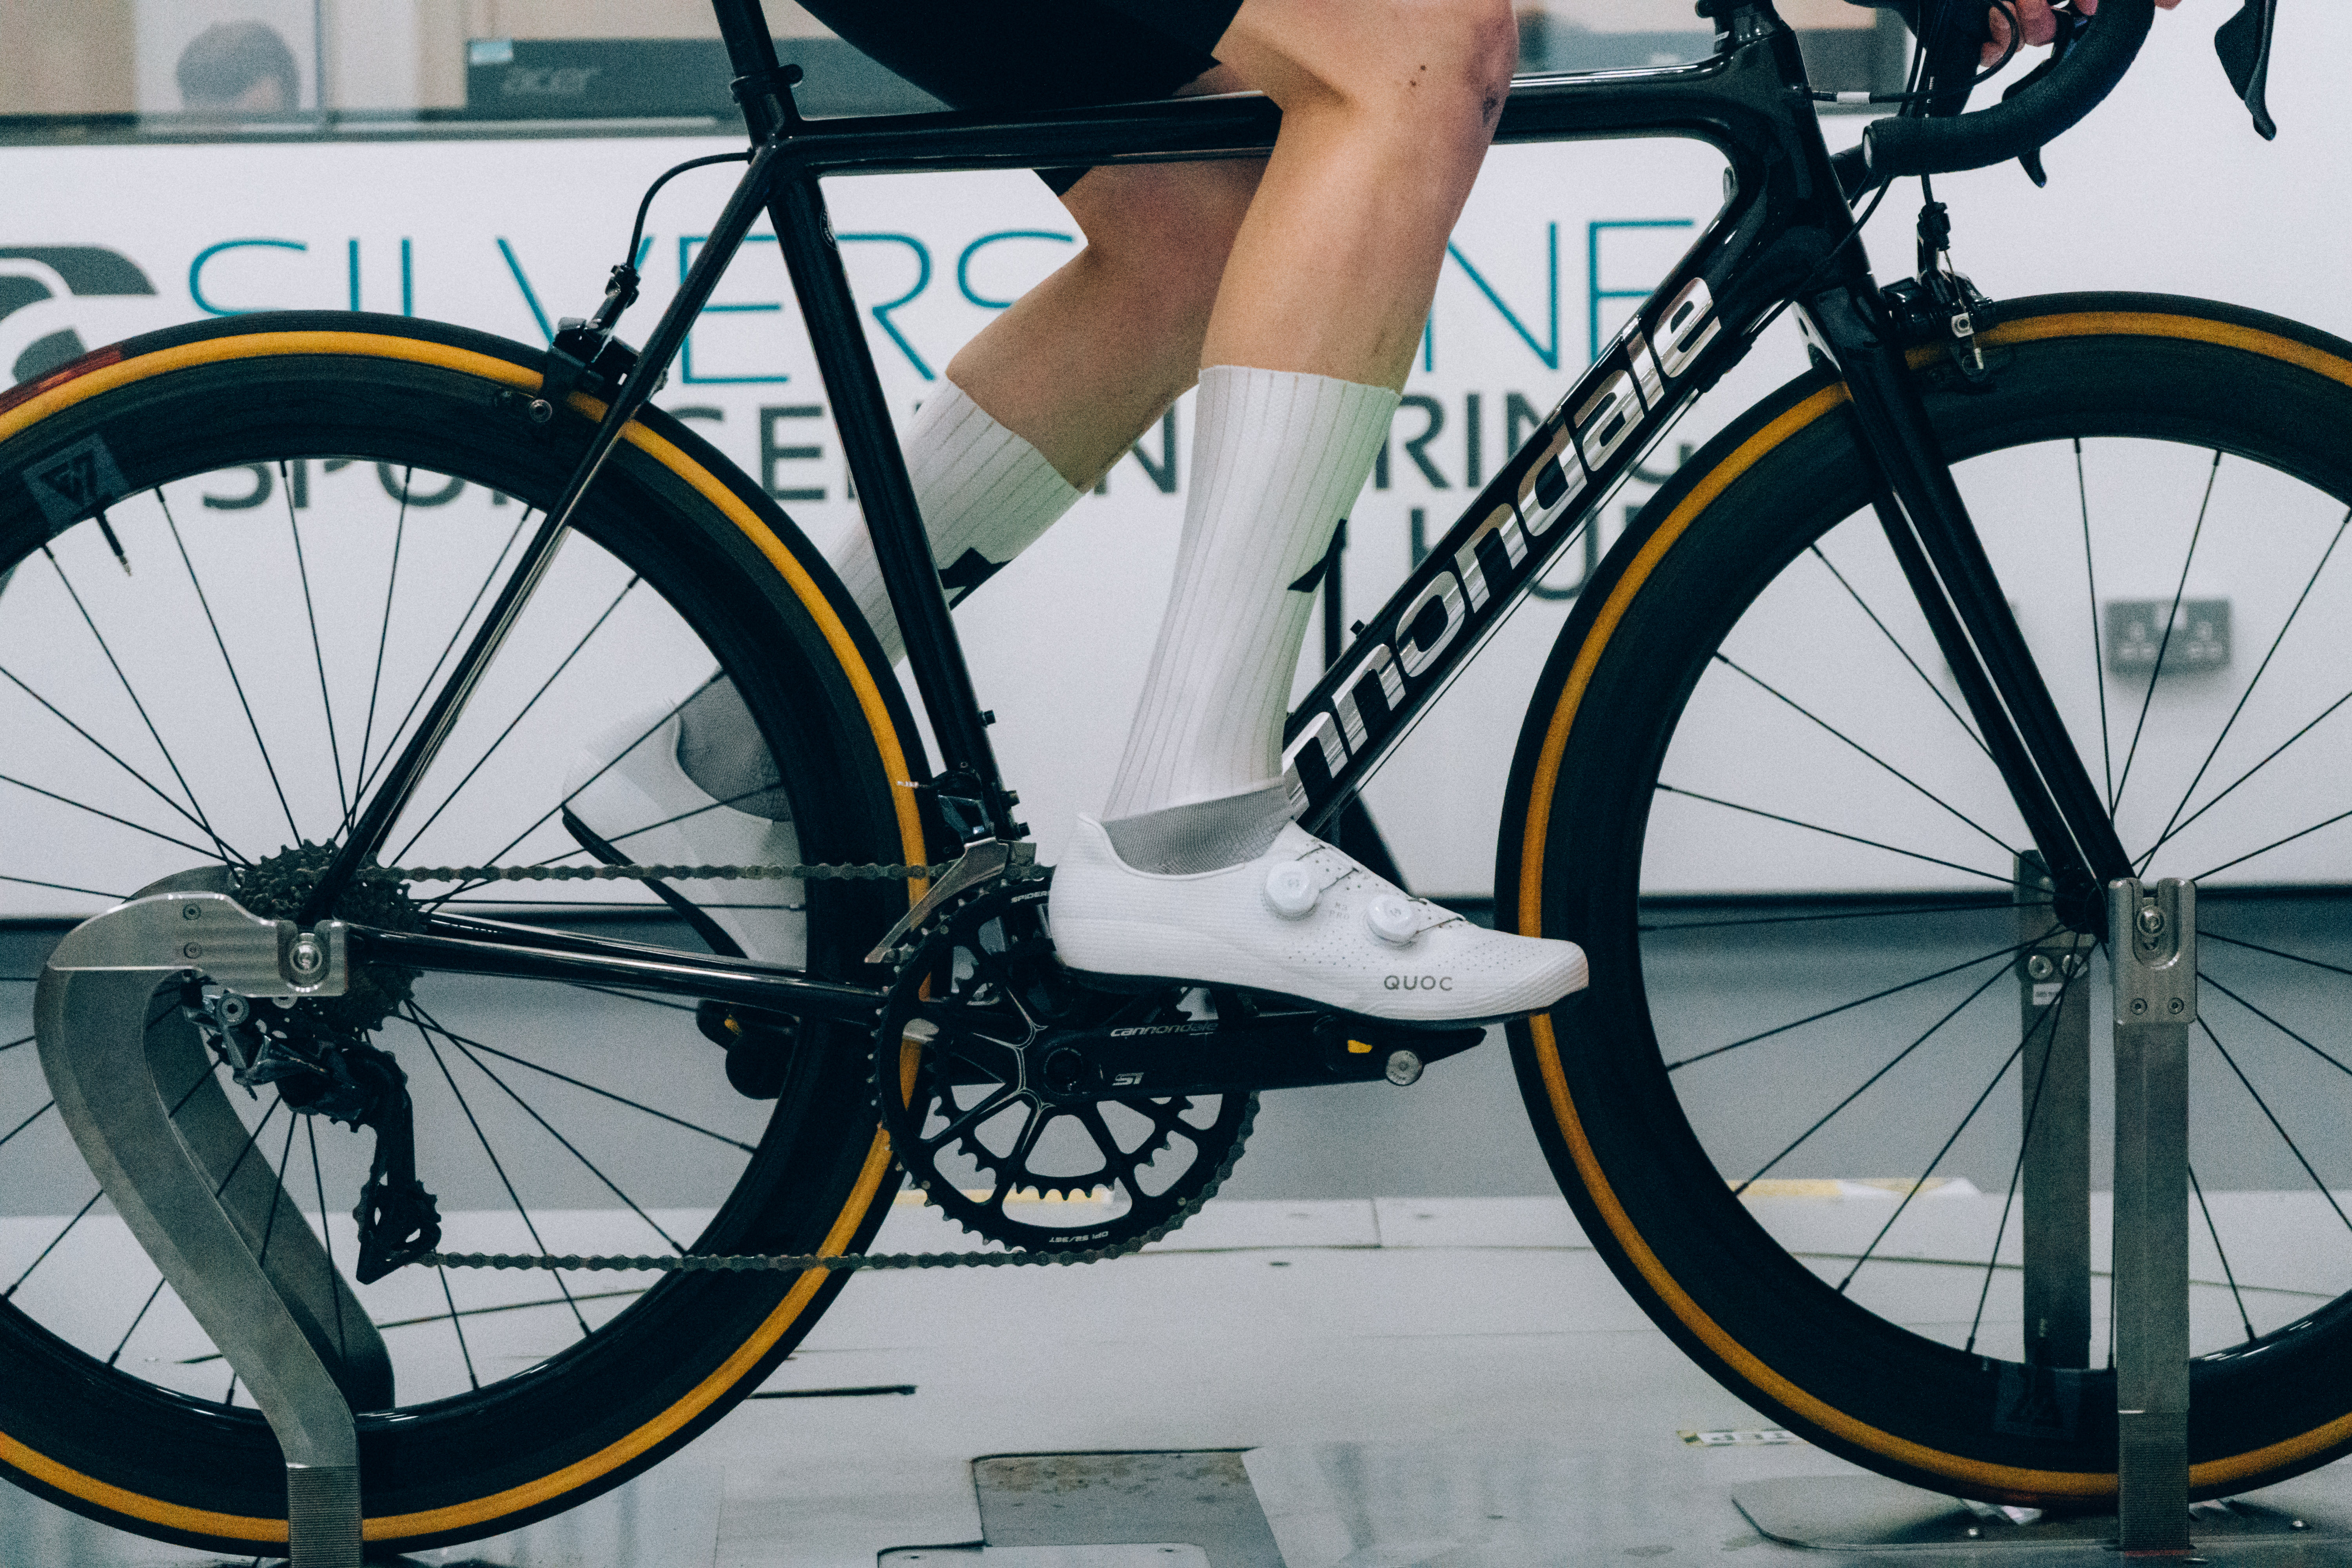
Average Weighted CdA: 0.3415M²
Watts at 45km/h: 400.22
Speed at 250 watts: 38.467km/h
Distance gained vs baseline: 66.4m
Time to cover 40km: 01h 02m 23s
Time saved vs slowest: 29s
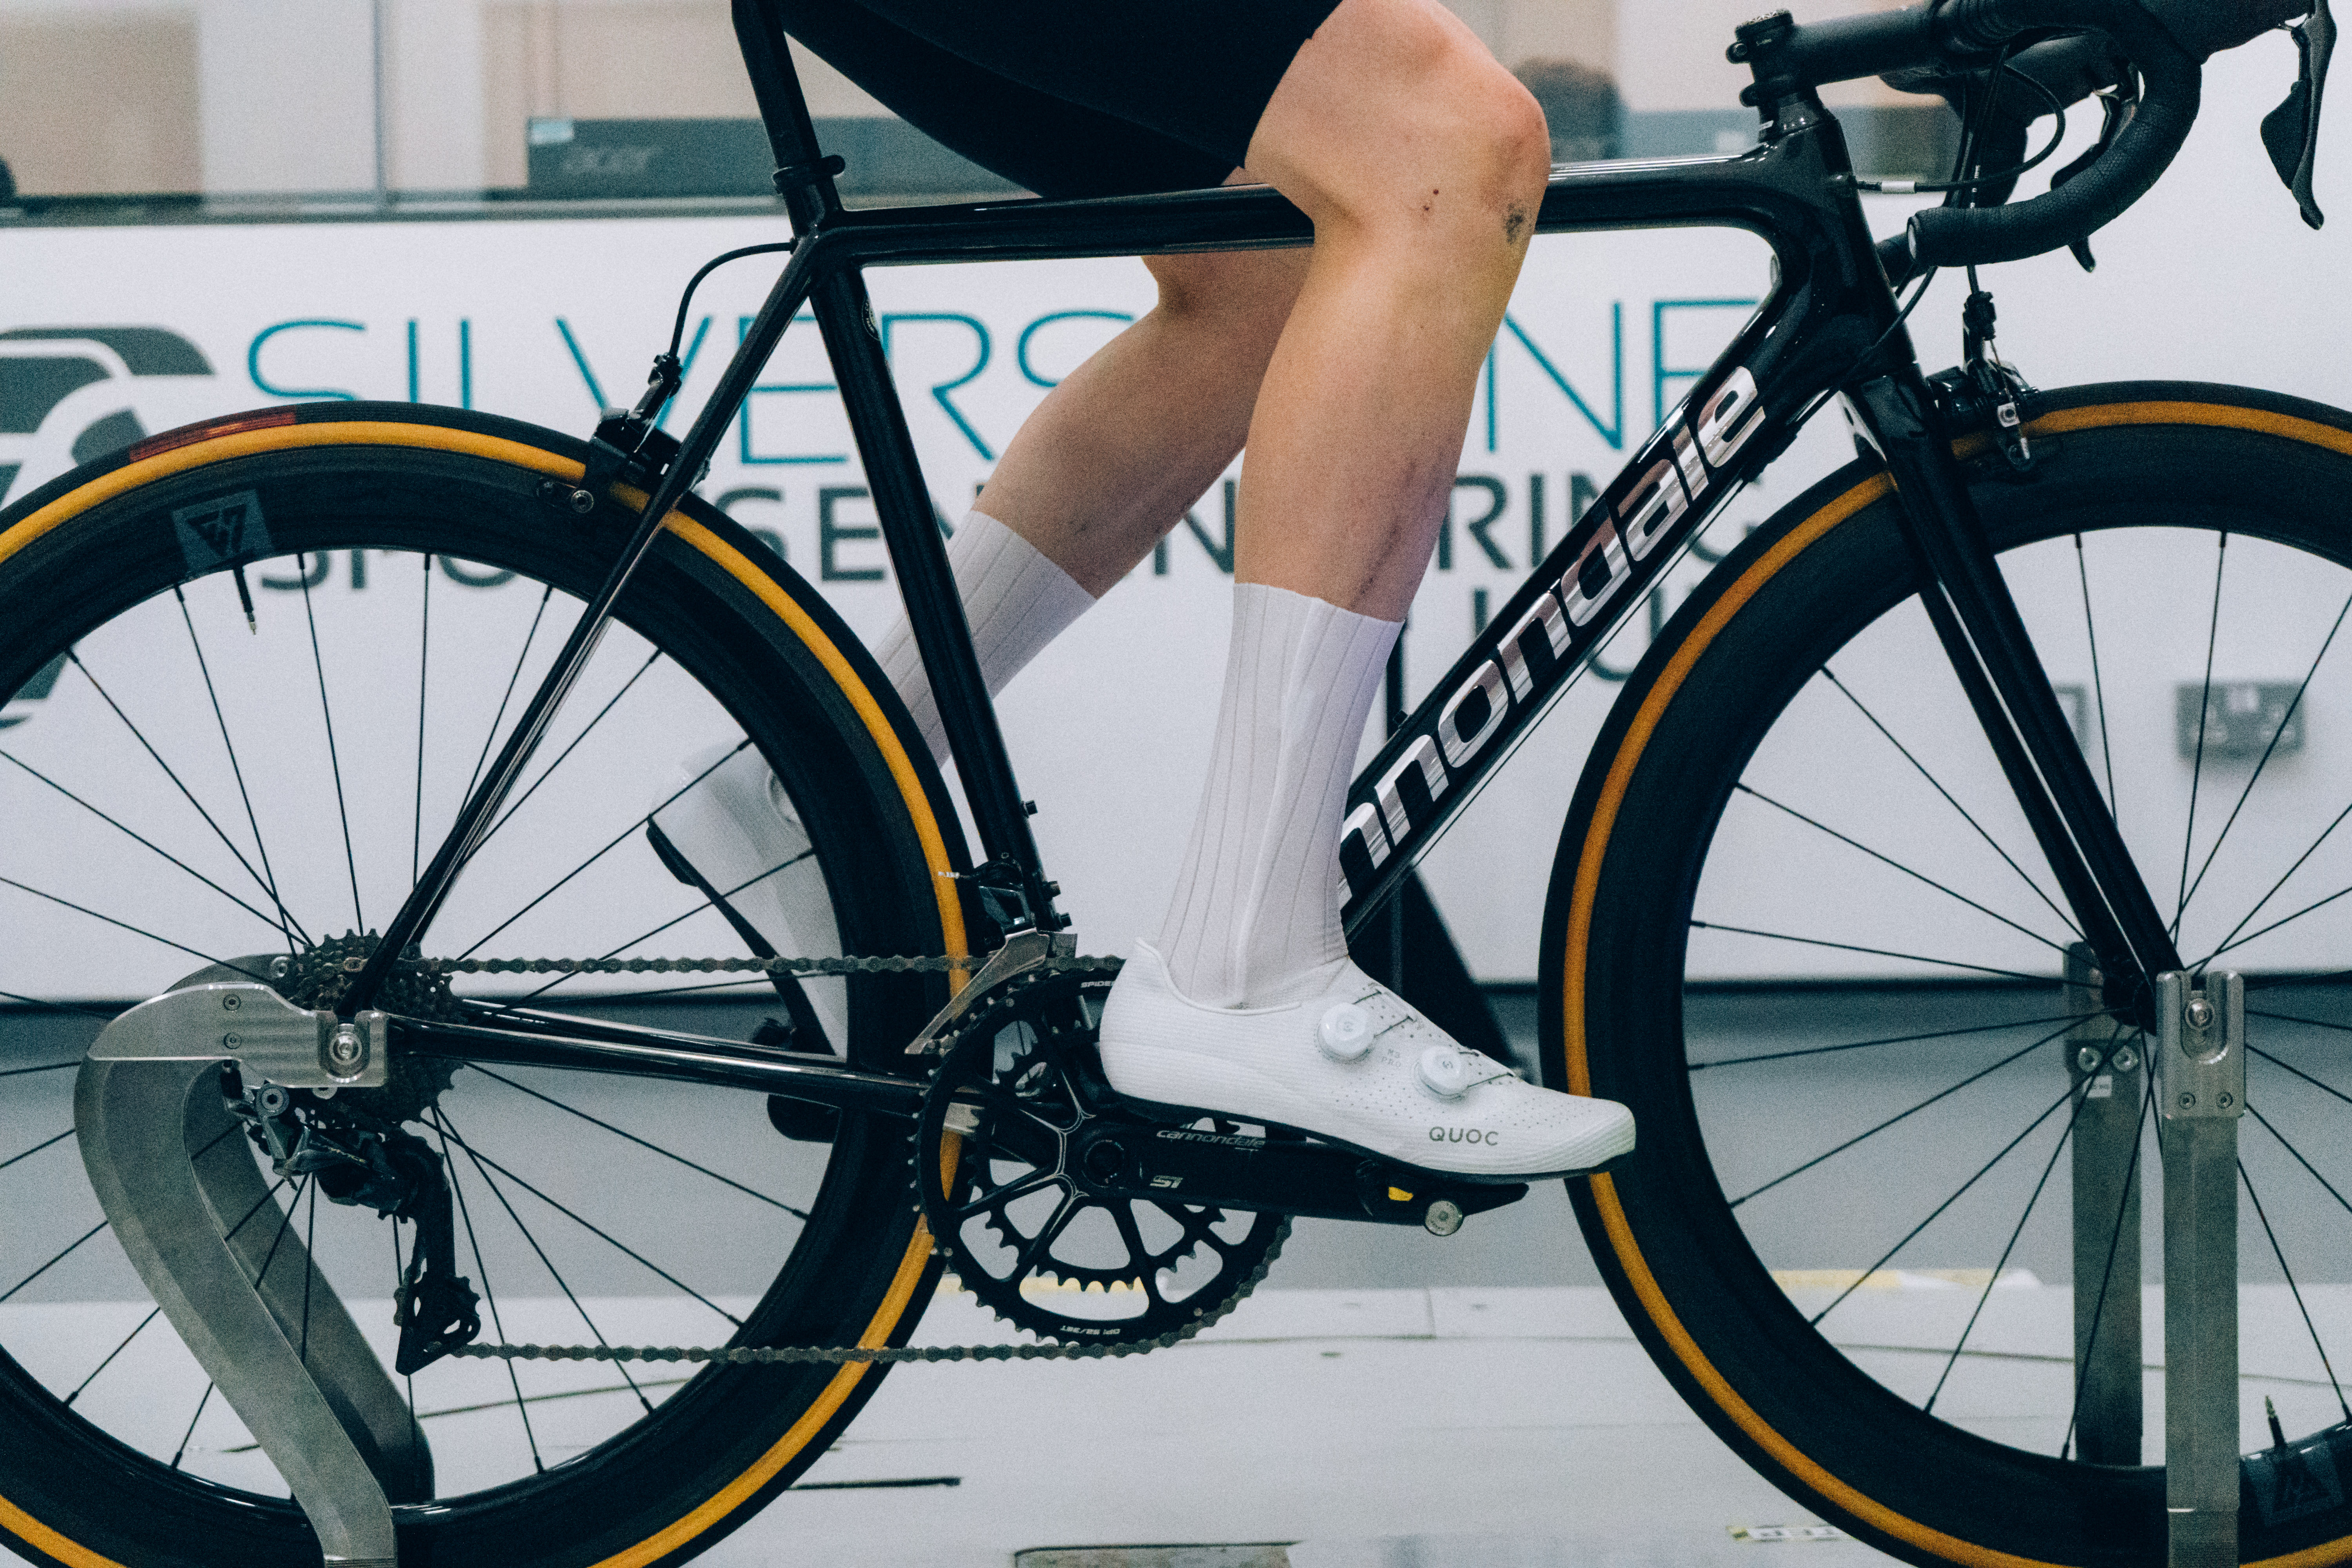
Average Weighted CdA: 0.3423M²
Watts at 45km/h: 401.16
Speed at 250 watts: 38.437km/h
Distance gained vs baseline: 36.2m
Time to cover 40km: 01h 02m 26s
Time saved vs slowest: 26s
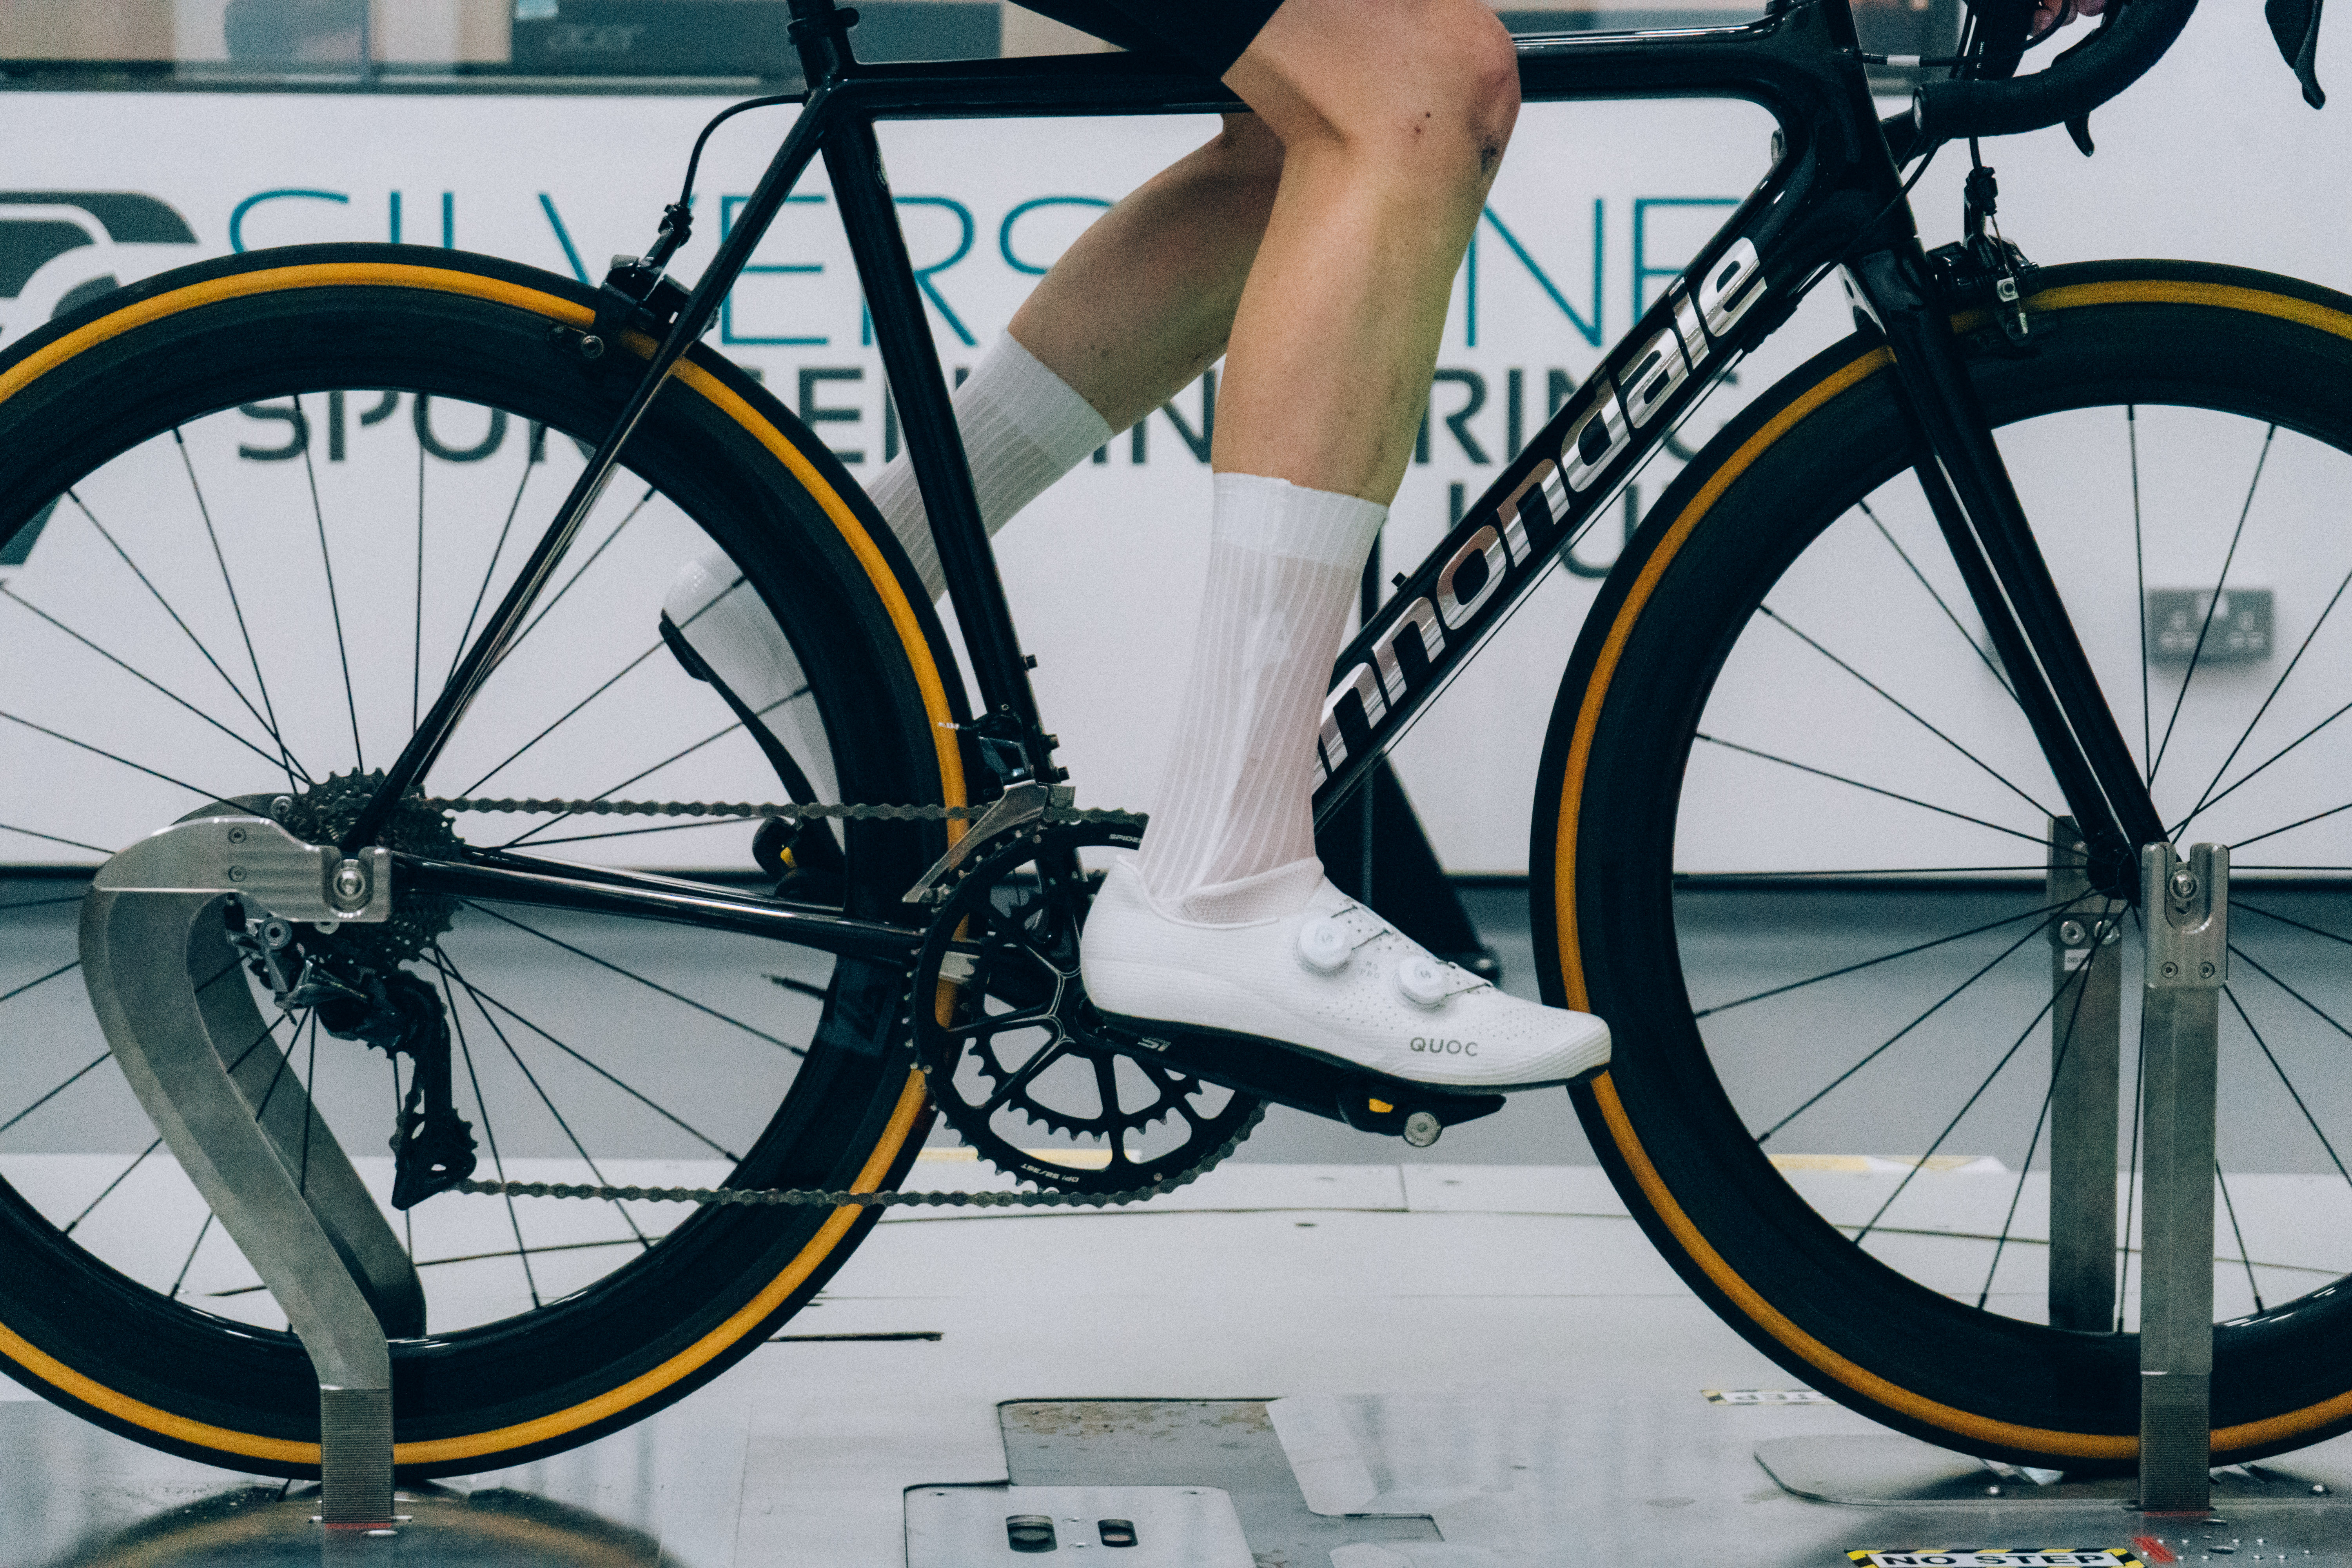
Average Weighted CdA: 0.3459M²
Watts at 45km/h: 405.30
Speed at 250 watts: 38.306km/h
Distance gained vs baseline: -94.9m
Time to cover 40km: 01h 02m 39s
Time saved vs slowest: 13s
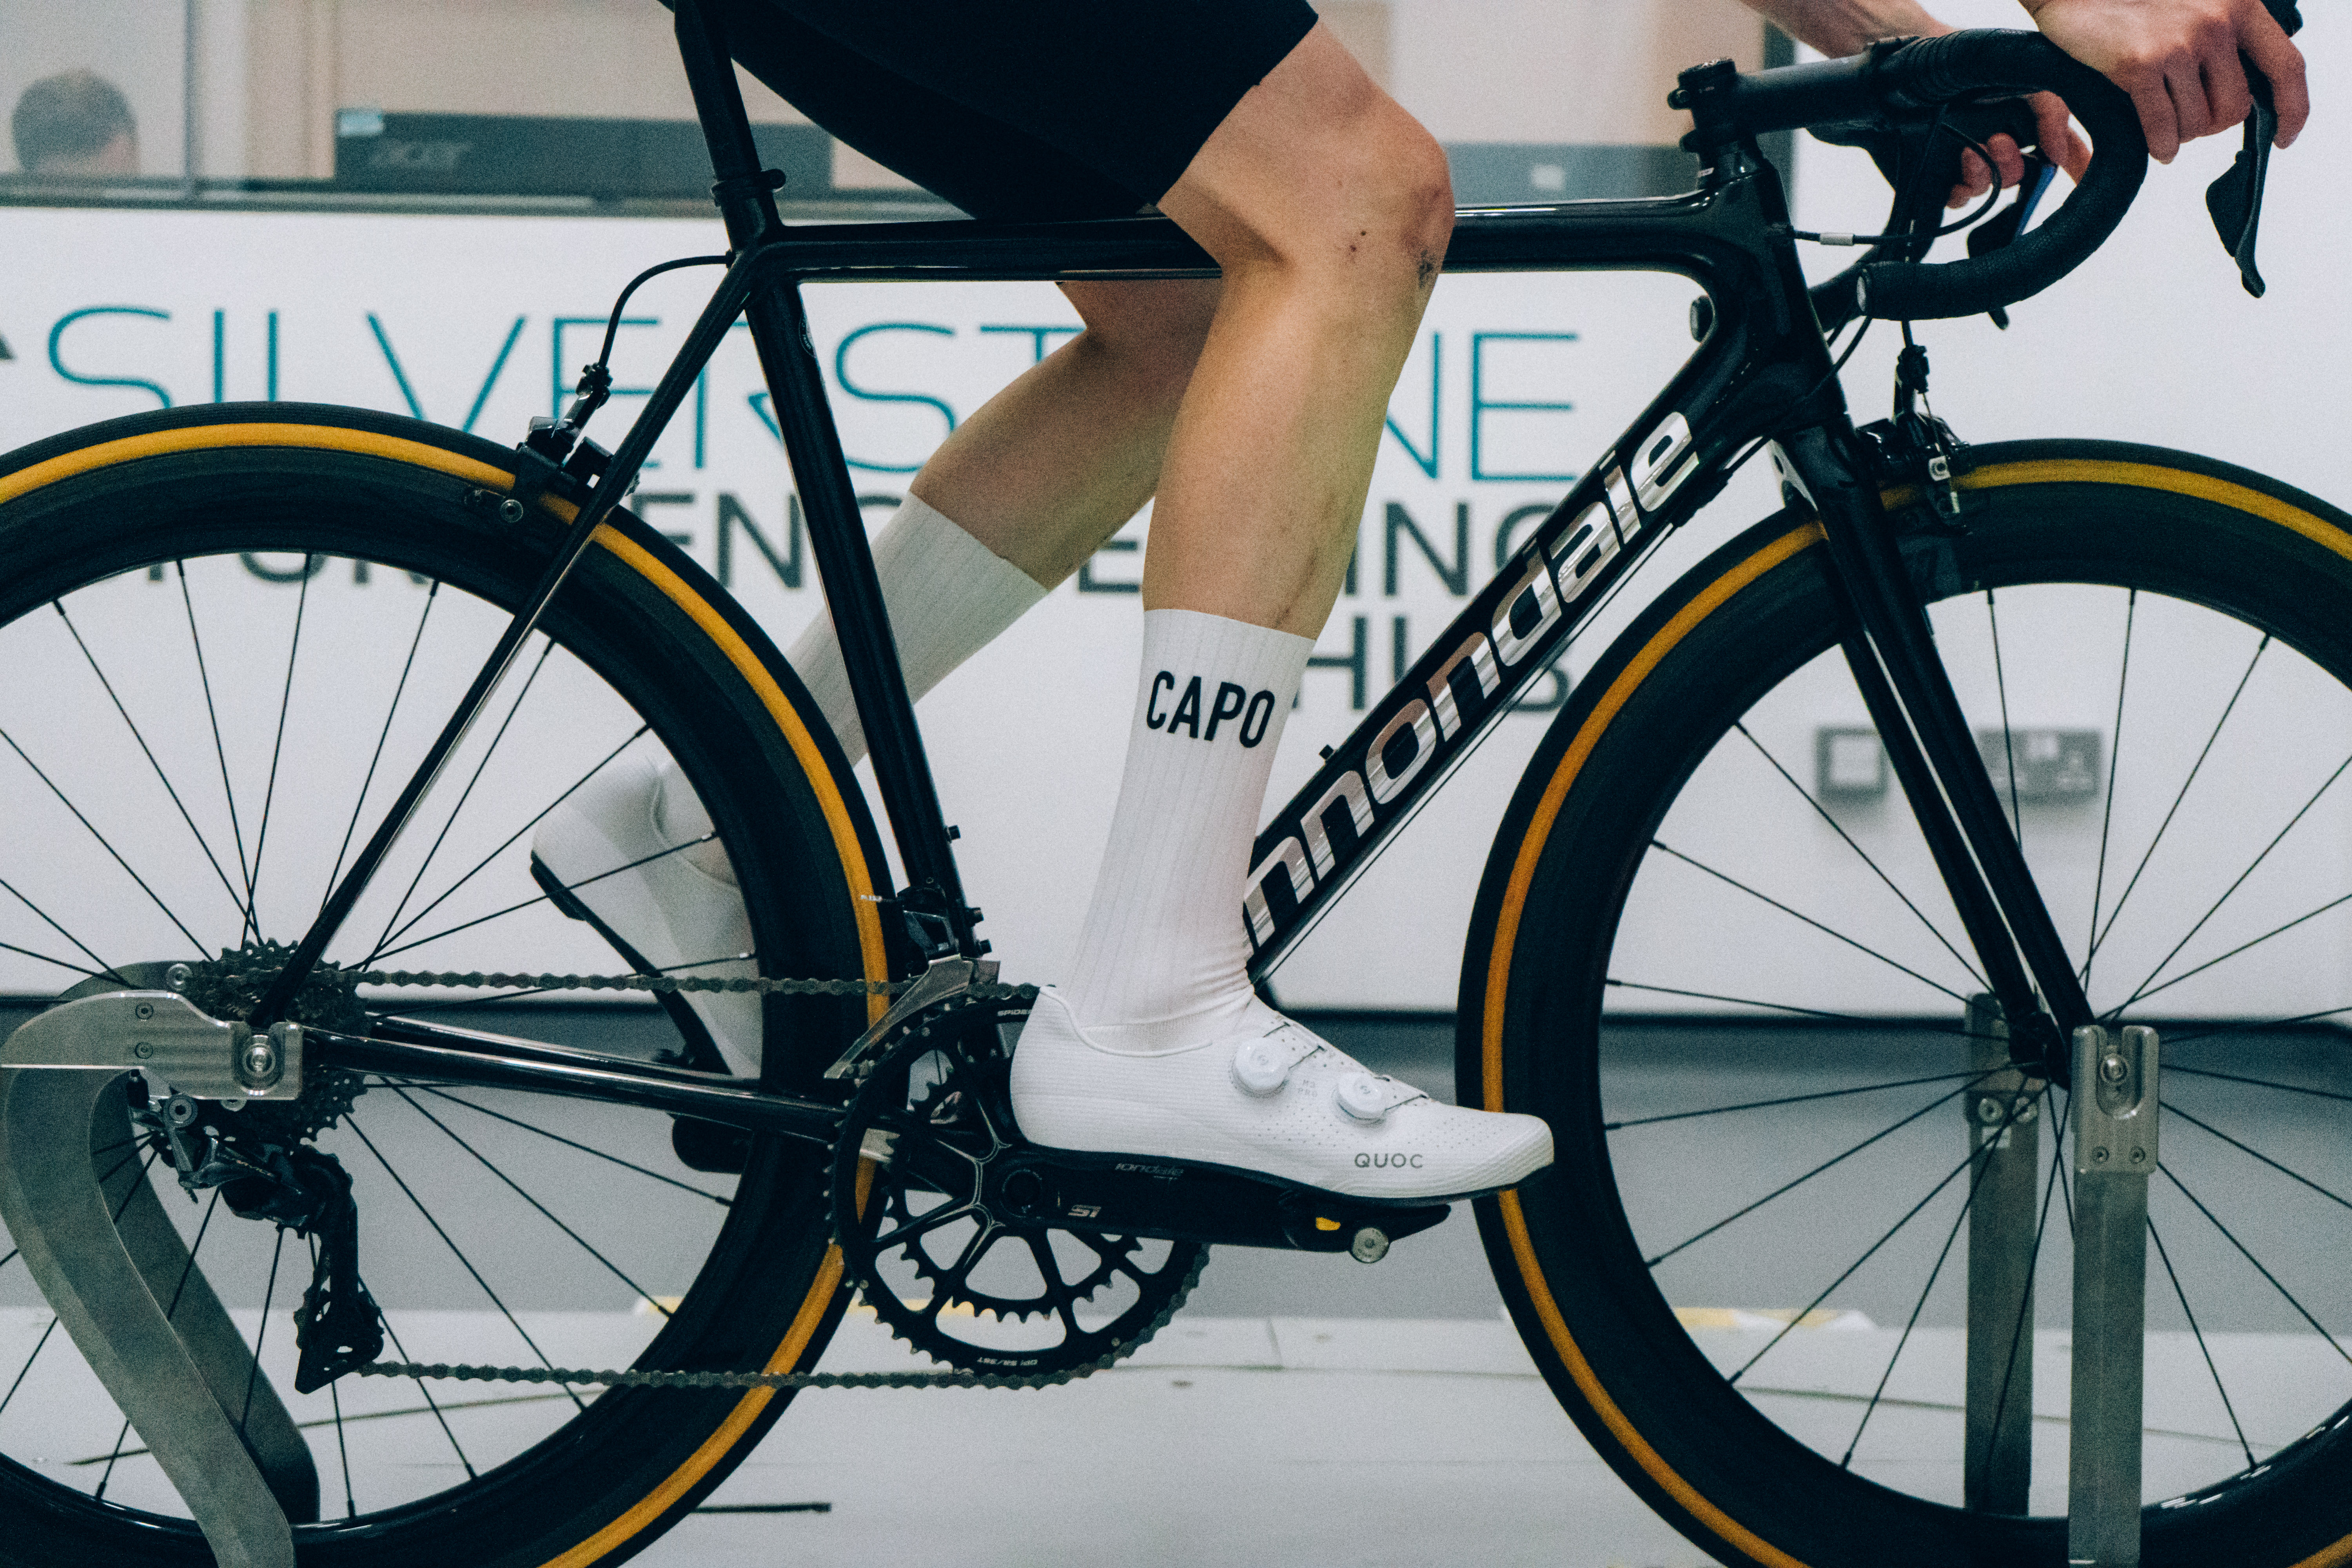
Average Weighted CdA: 0.3411M²
Watts at 45km/h: 399.69
Speed at 250 watts: 38.484km/h
Distance gained vs baseline: 83.4m
Time to cover 40km: 01h 02m 22s
Time saved vs slowest: 31s
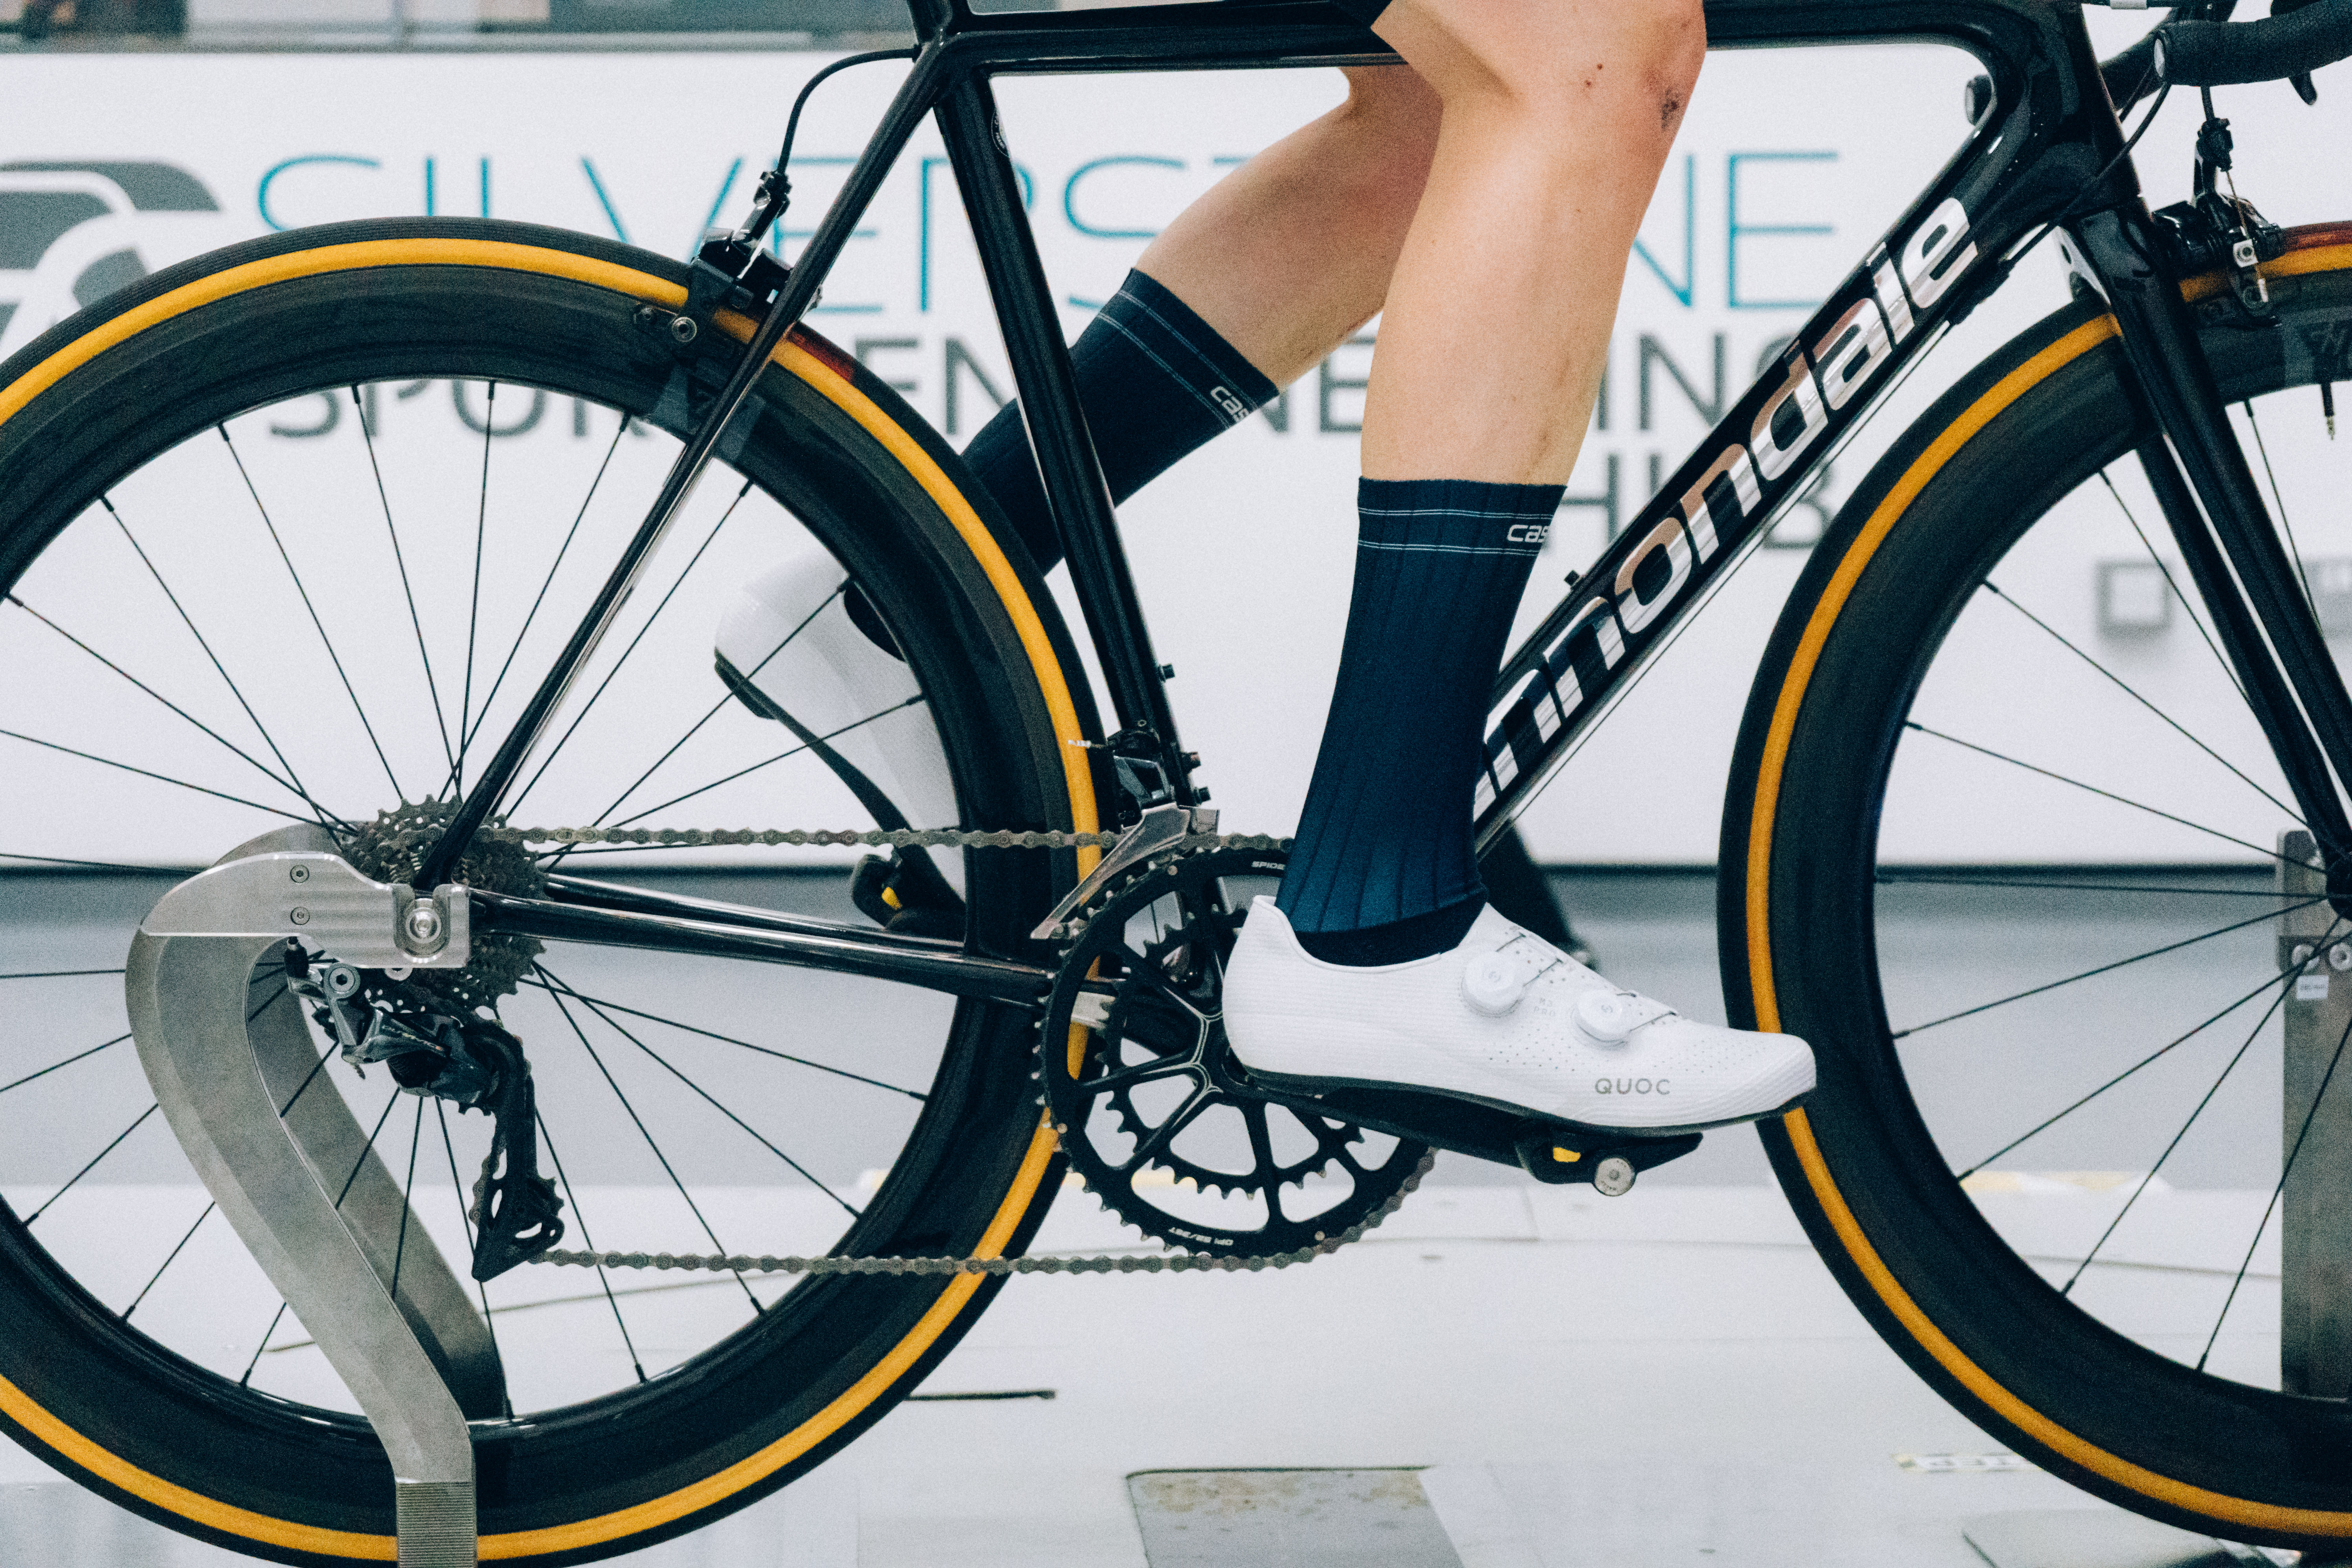
Average Weighted CdA: 0.3489M²
Watts at 45km/h: 408.83
Speed at 250 watts: 38.195km/h
Distance gained vs baseline: -205.6m
Time to cover 40km: 01h 02m 50s
Time saved vs slowest: 3s
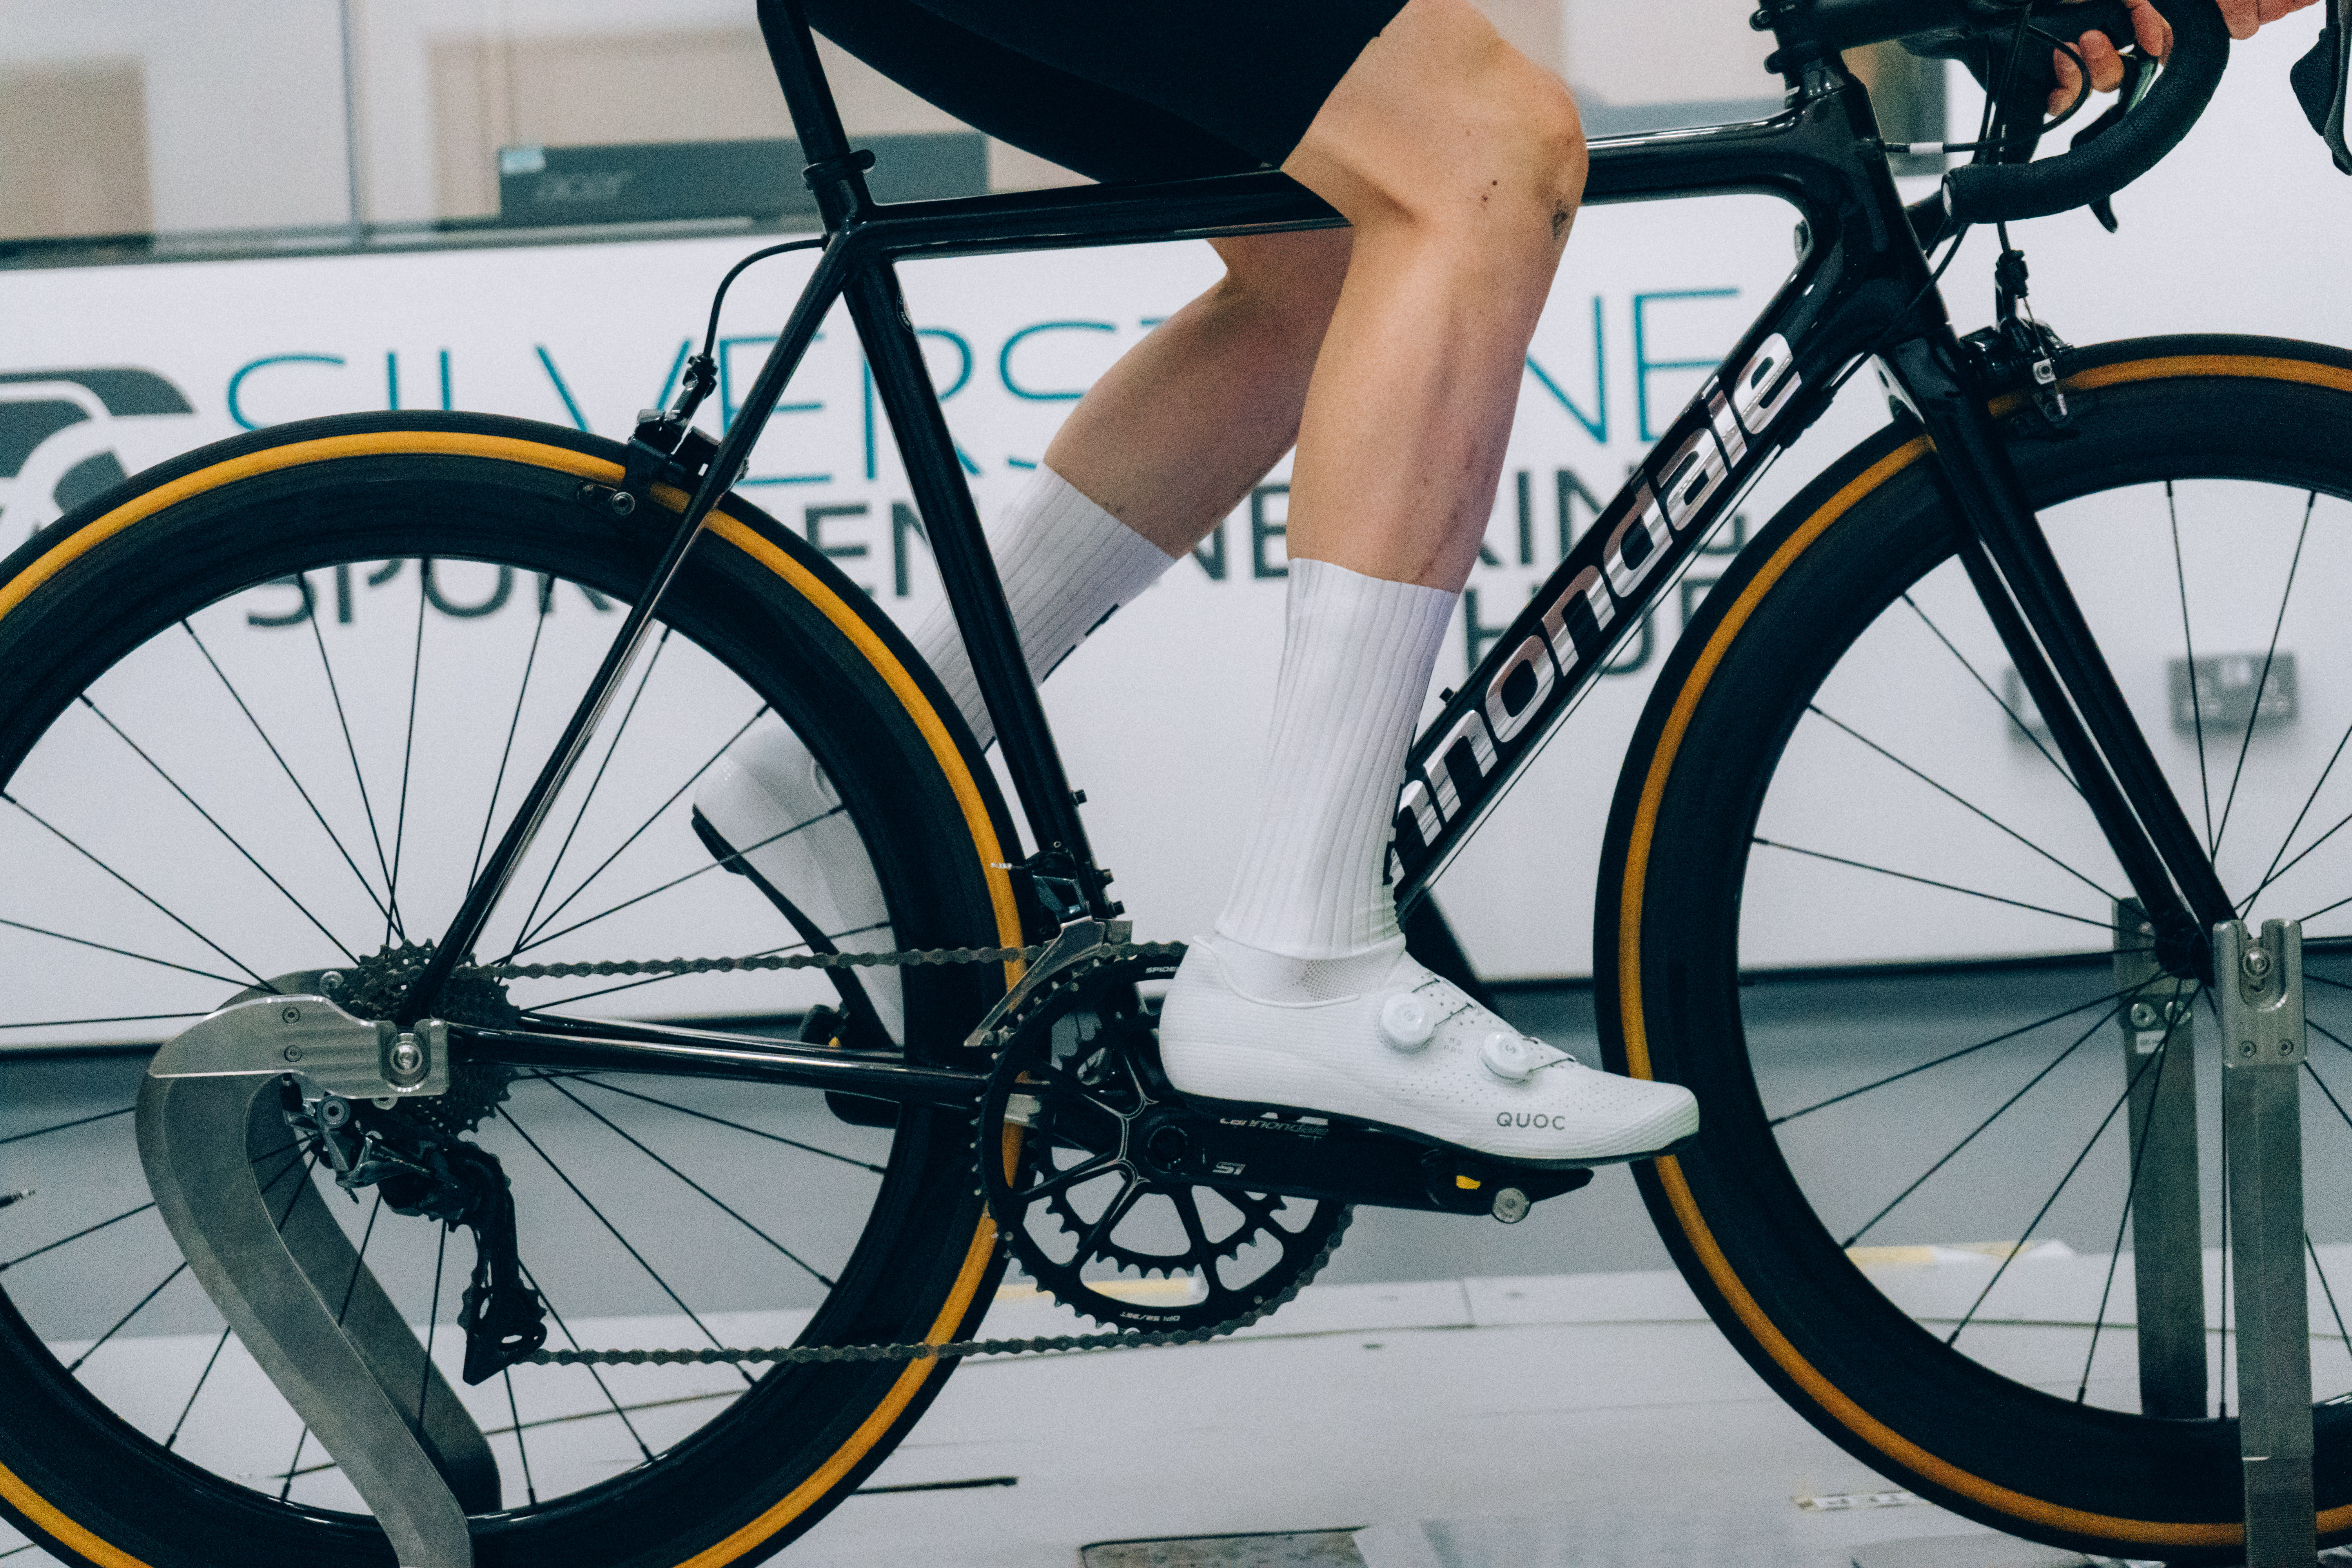
Average Weighted CdA: 0.3496M²
Watts at 45km/h: 409.67
Speed at 250 watts: 38.169km/h
Distance gained vs baseline: -231.9m
Time to cover 40km: 01h 02m 53s
Time saved vs slowest: 0s (slowest on test)
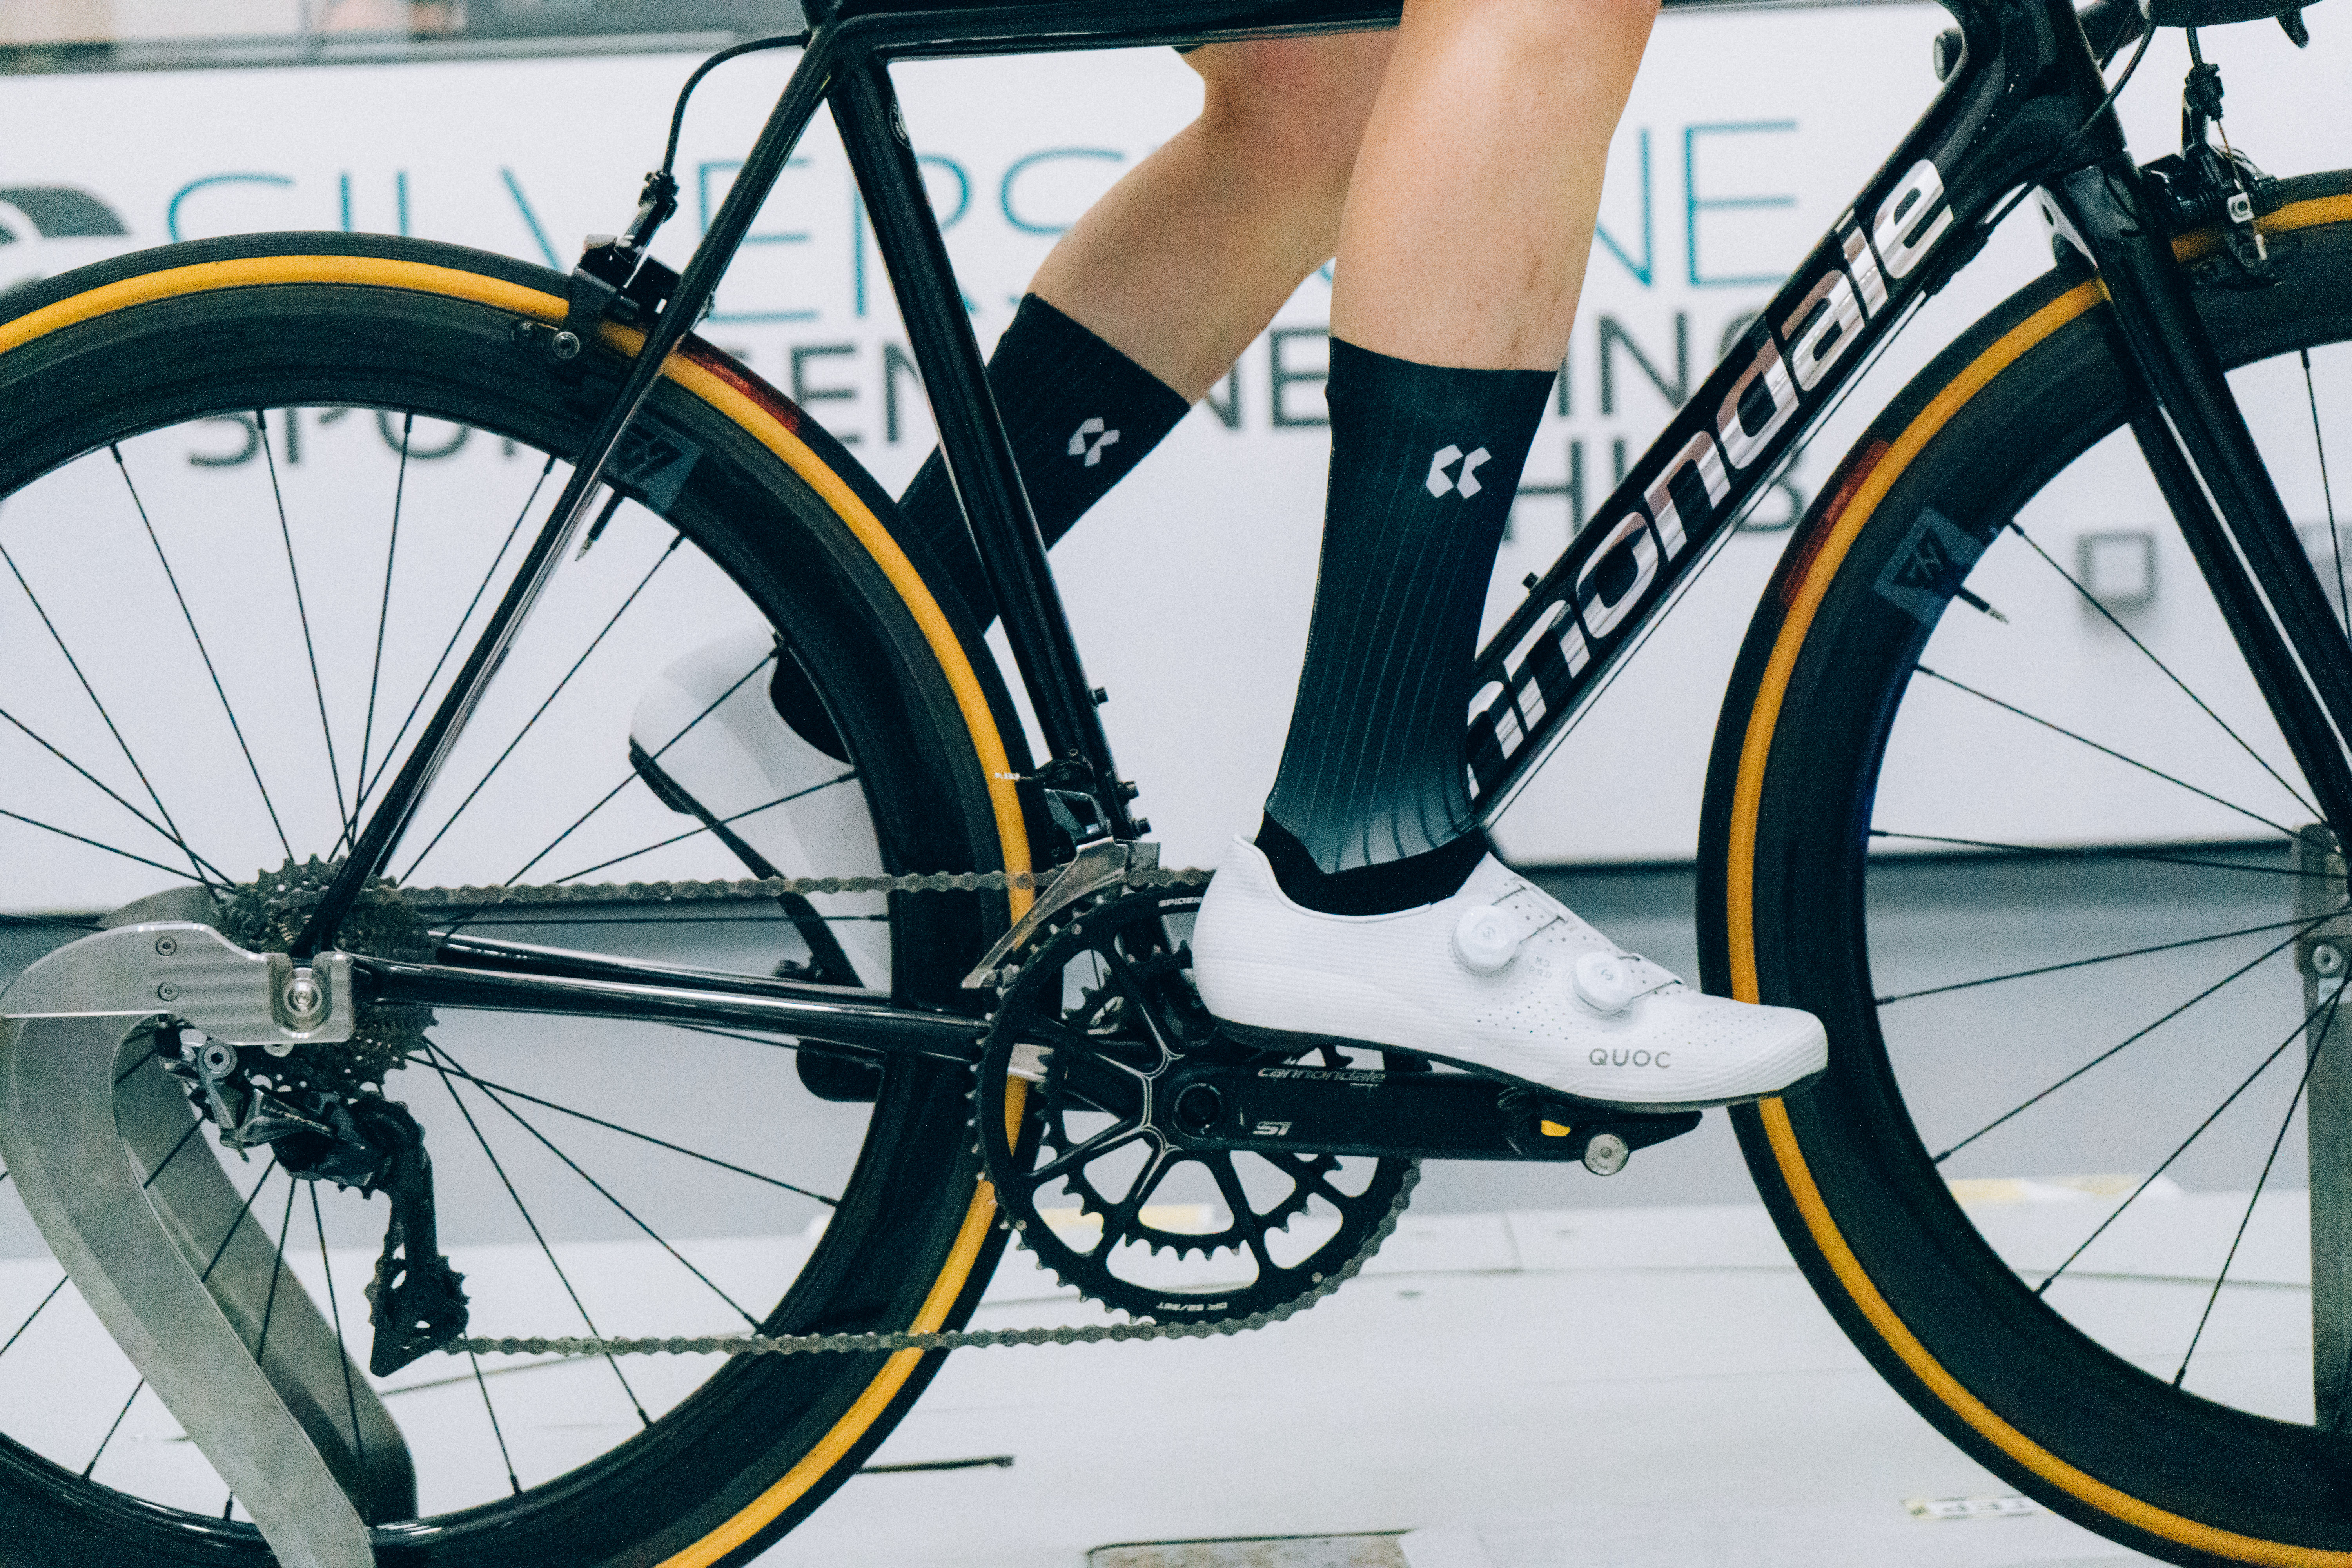
Average Weighted CdA: 0.3438M²
Watts at 45km/h: 402.90
Speed at 250 watts: 38.382km/h
Distance gained vs baseline: -19.2m
Time to cover 40km: 01h 02m 32s
Time saved vs slowest: 21s
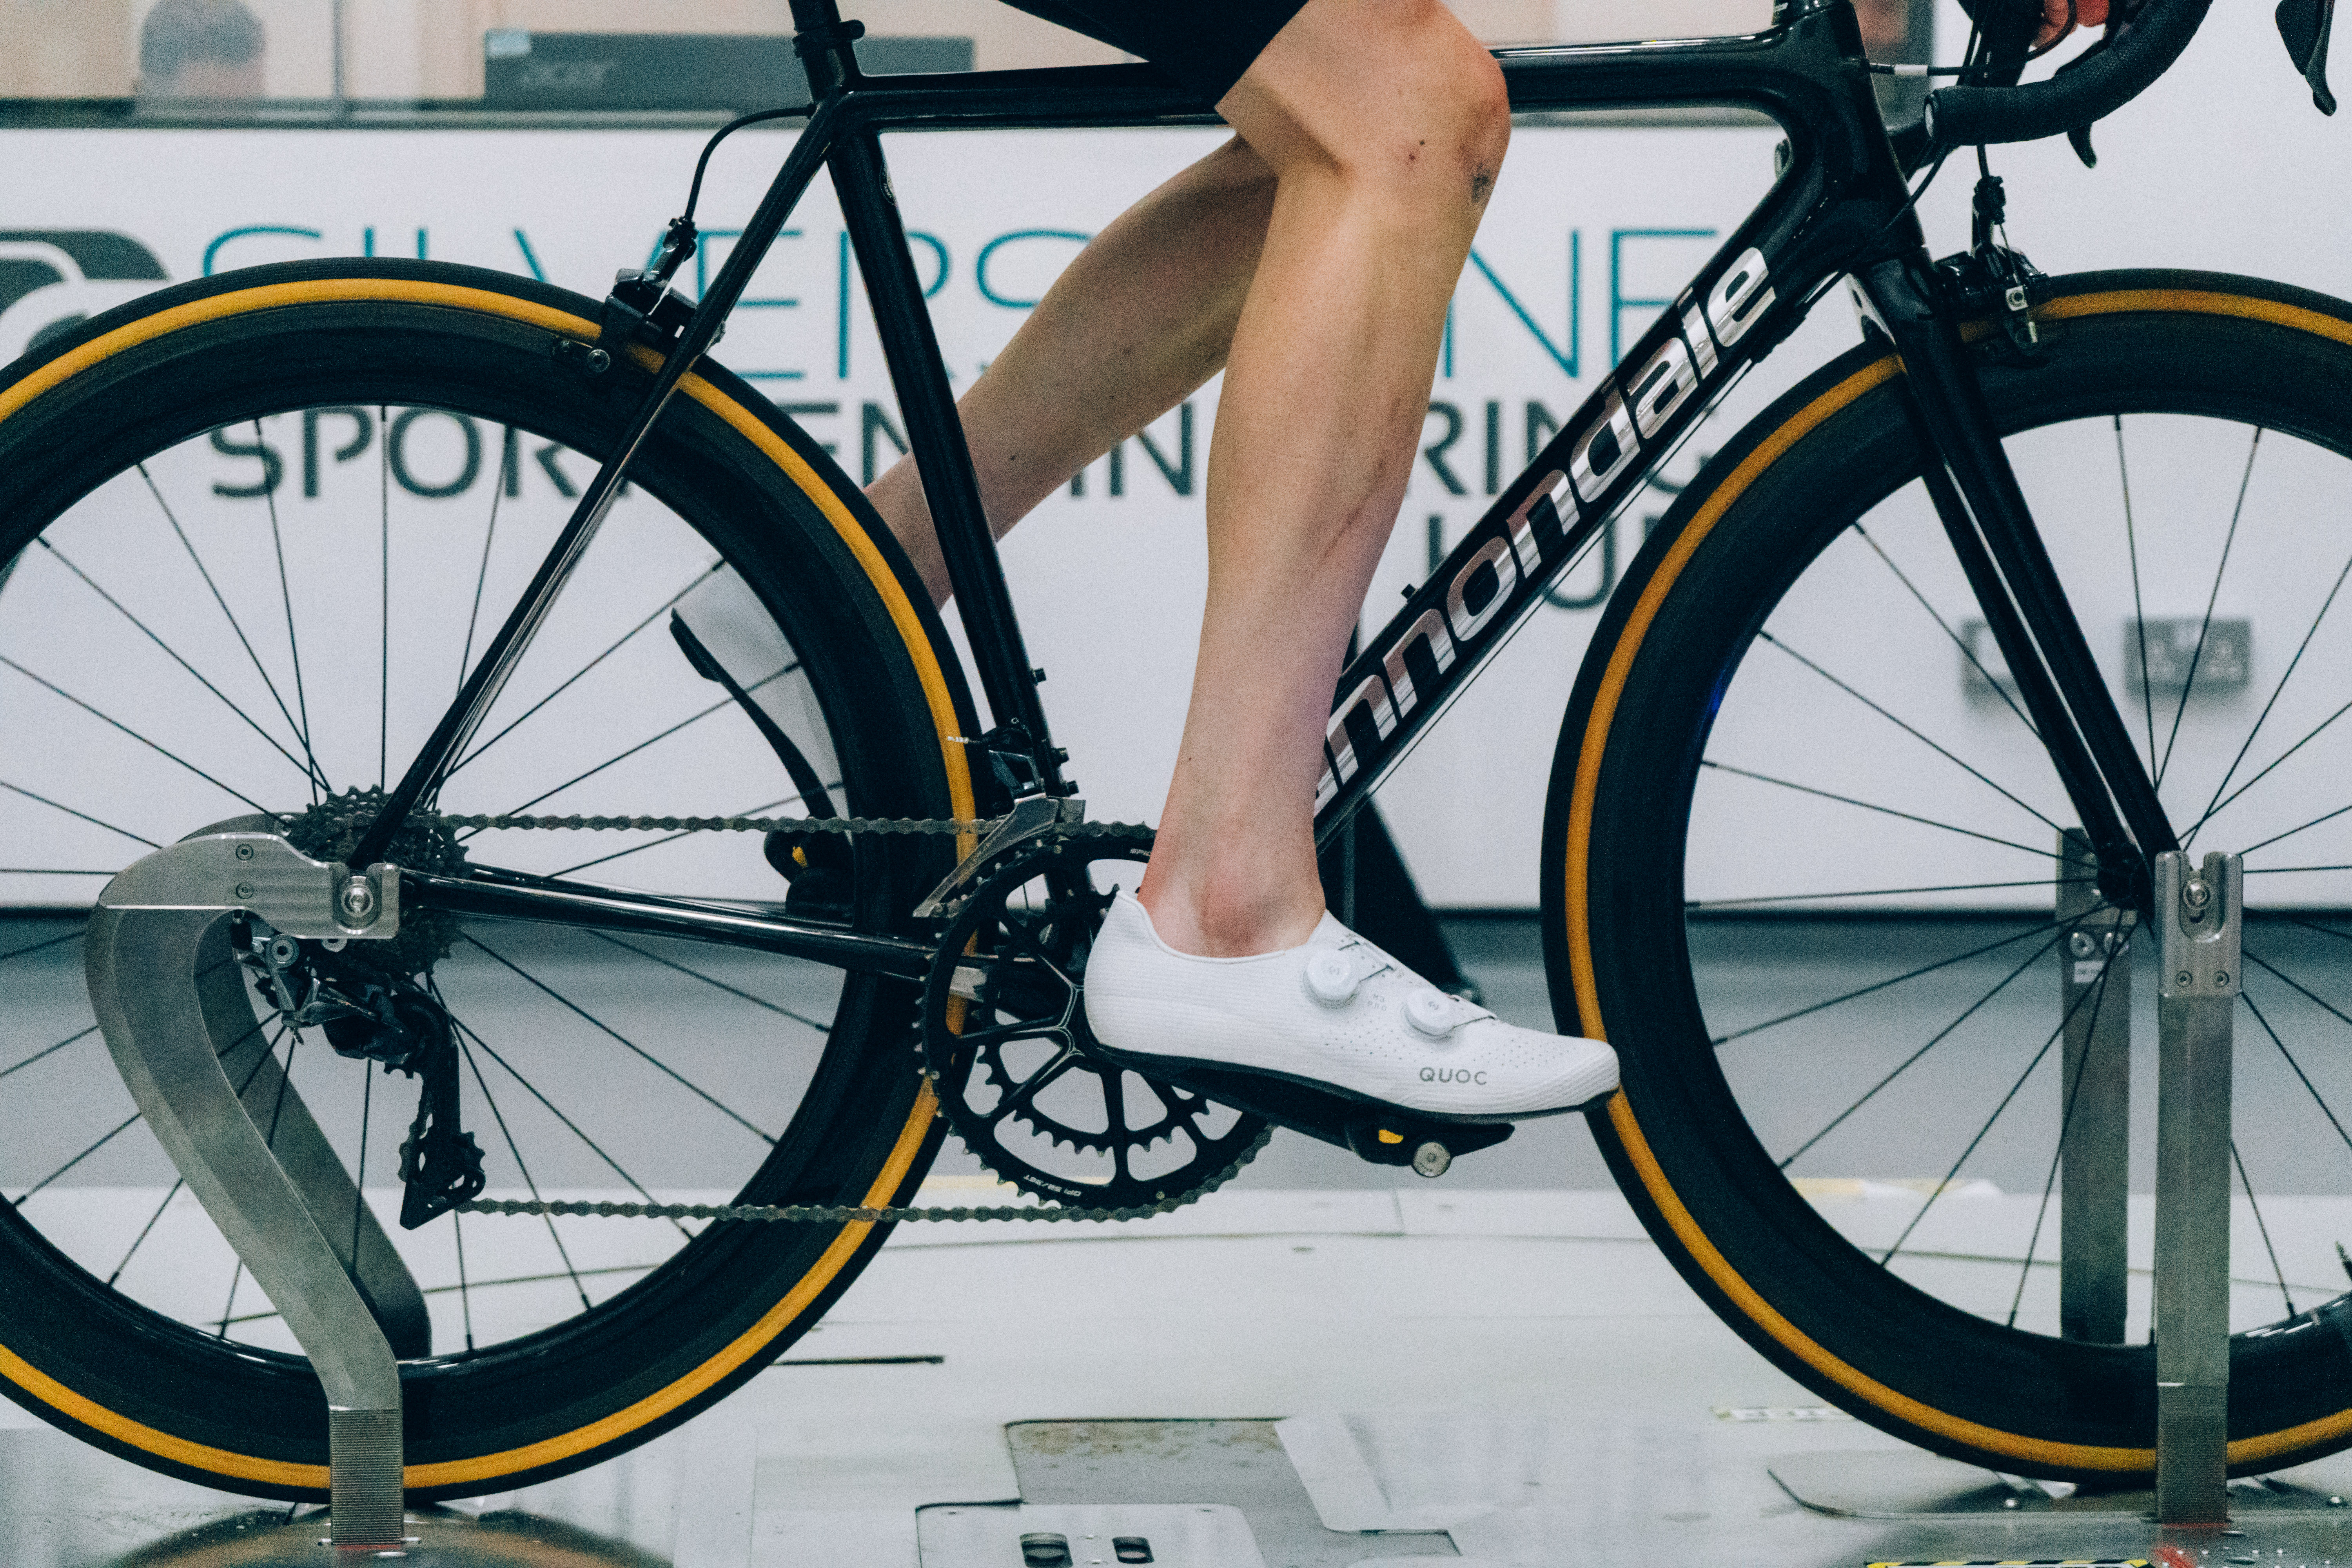
Average Weighted CdA: 0.3445M²
Watts at 45km/h: 403.72
Speed at 250 watts: 38.356km/h
Distance gained vs baseline: -45.2m
Time to cover 40km: 01h 02m 34s
Time saved vs slowest: 18s
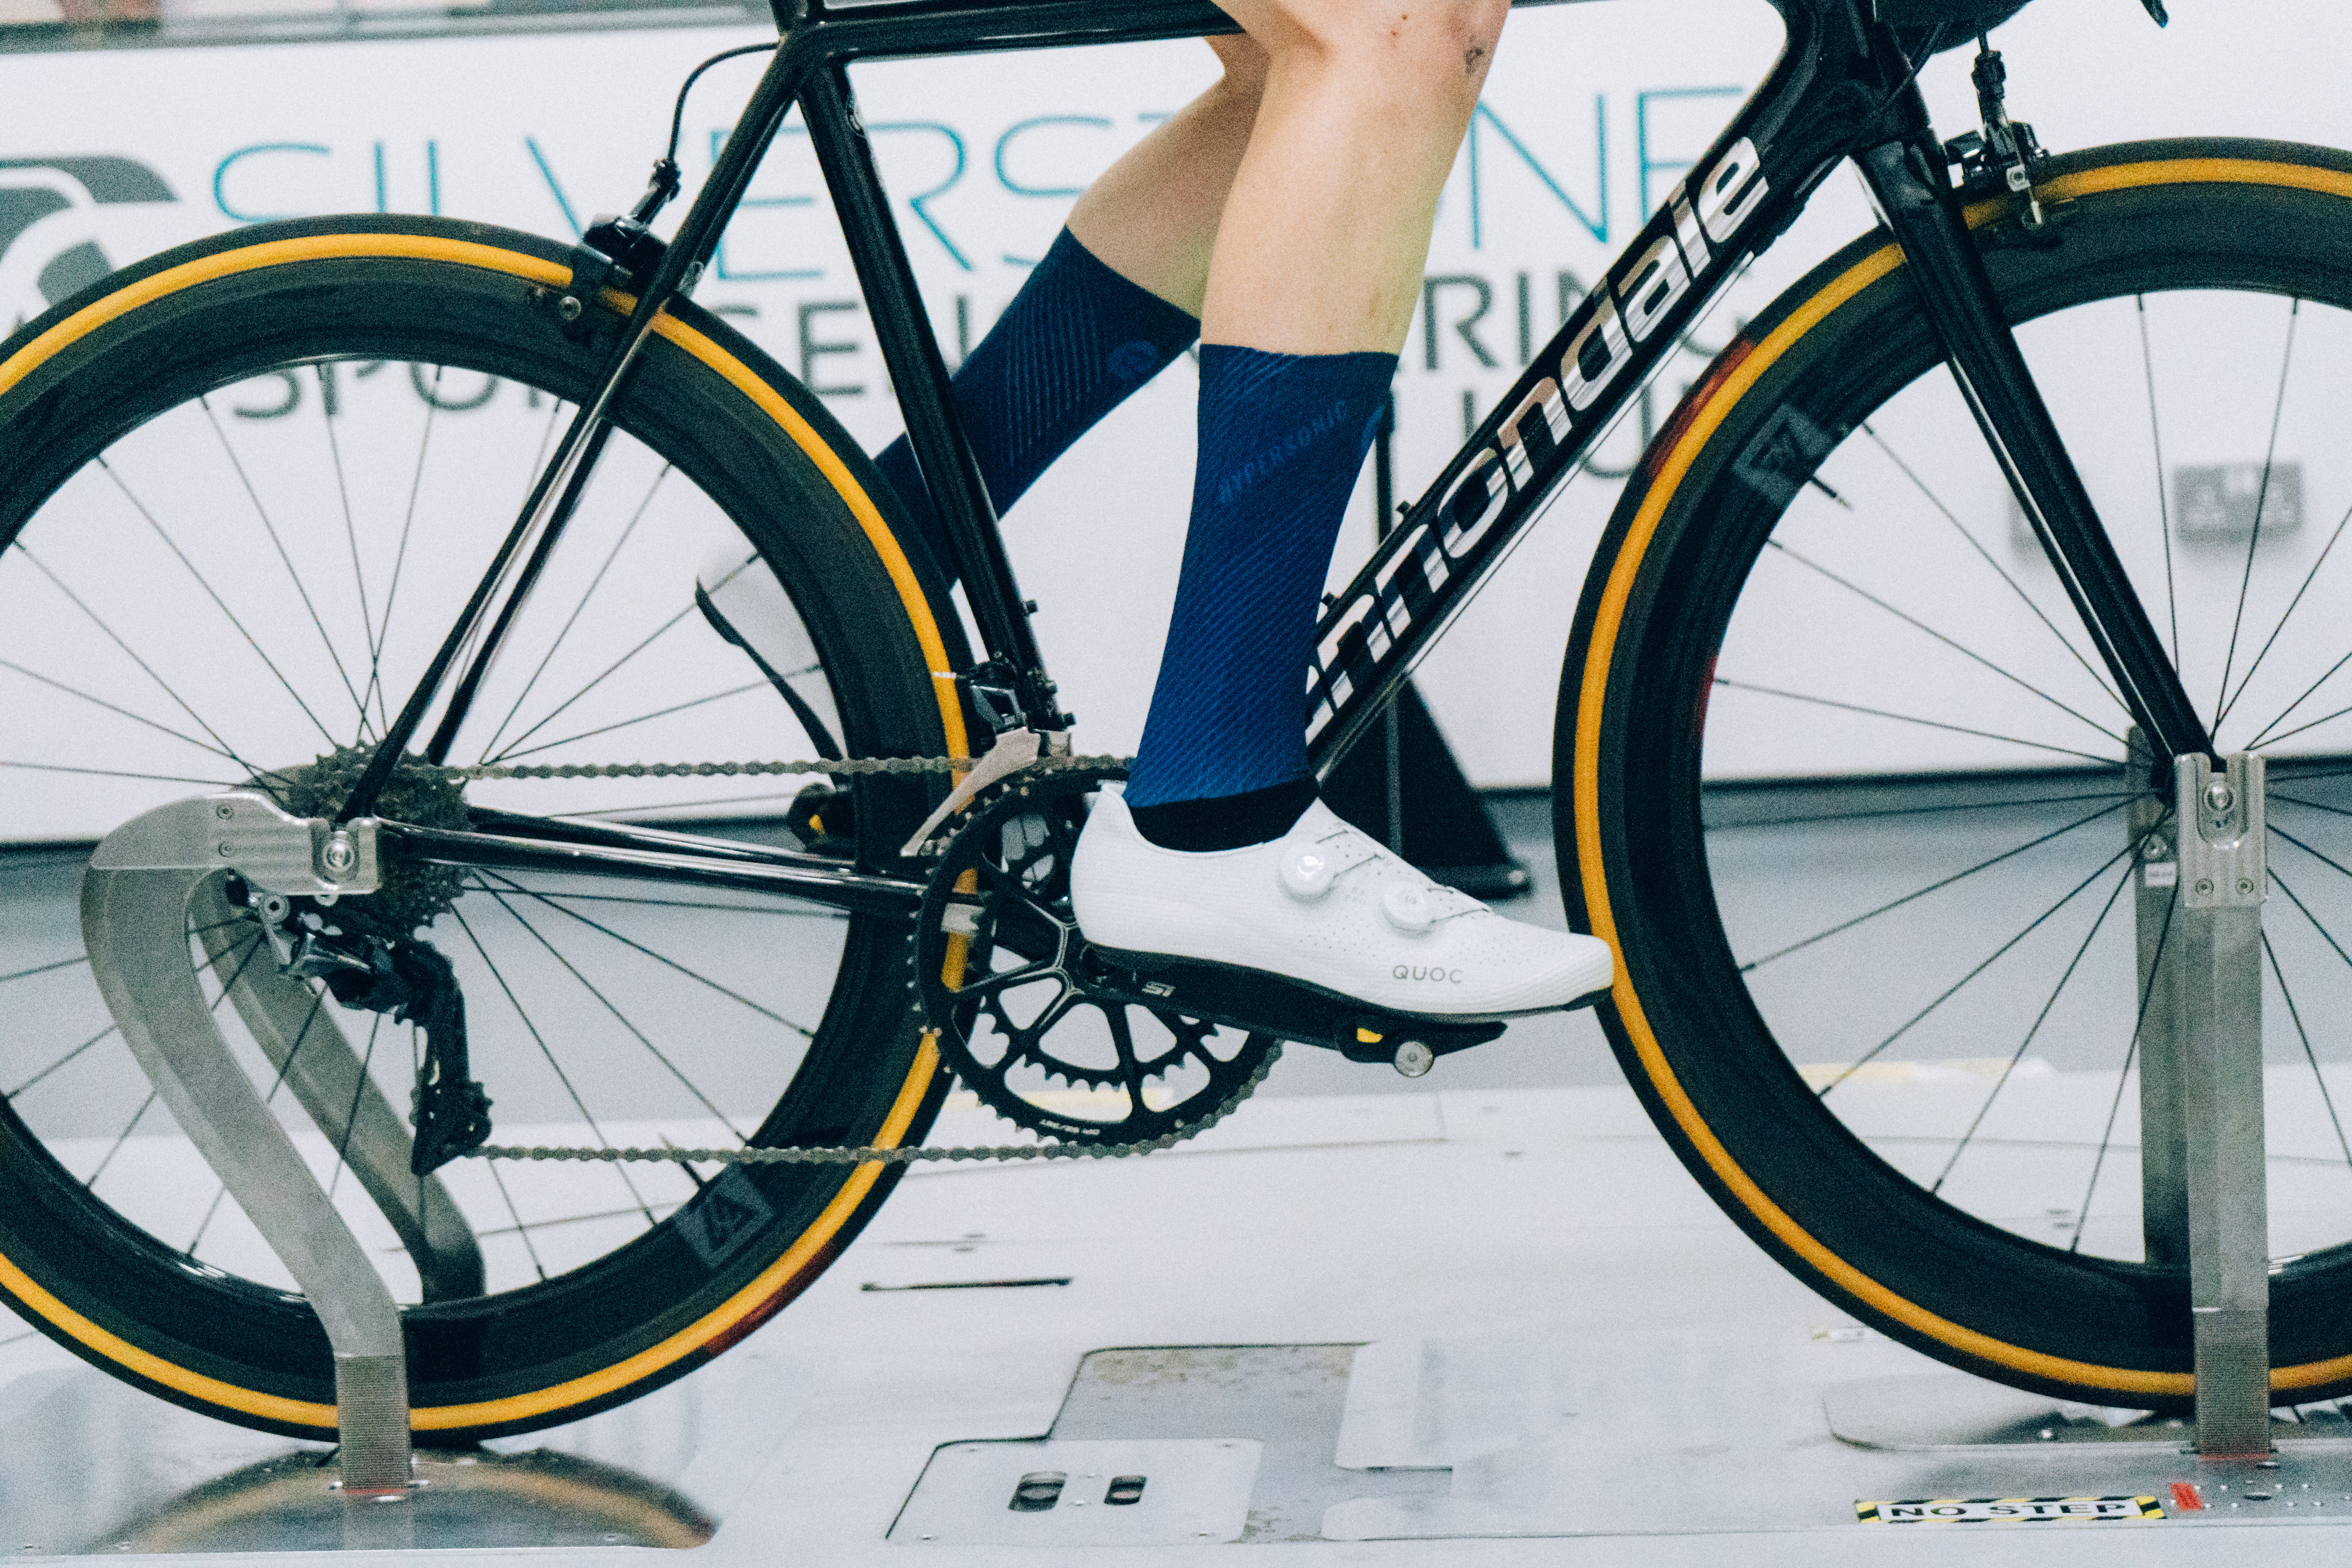
Average Weighted CdA: 0.3424M²
Watts at 45km/h: 401.19
Speed at 250 watts: 38.436km/h
Distance gained vs baseline: 35.2m
Time to cover 40km: 01h 02m 26s
Time saved vs slowest: 26s
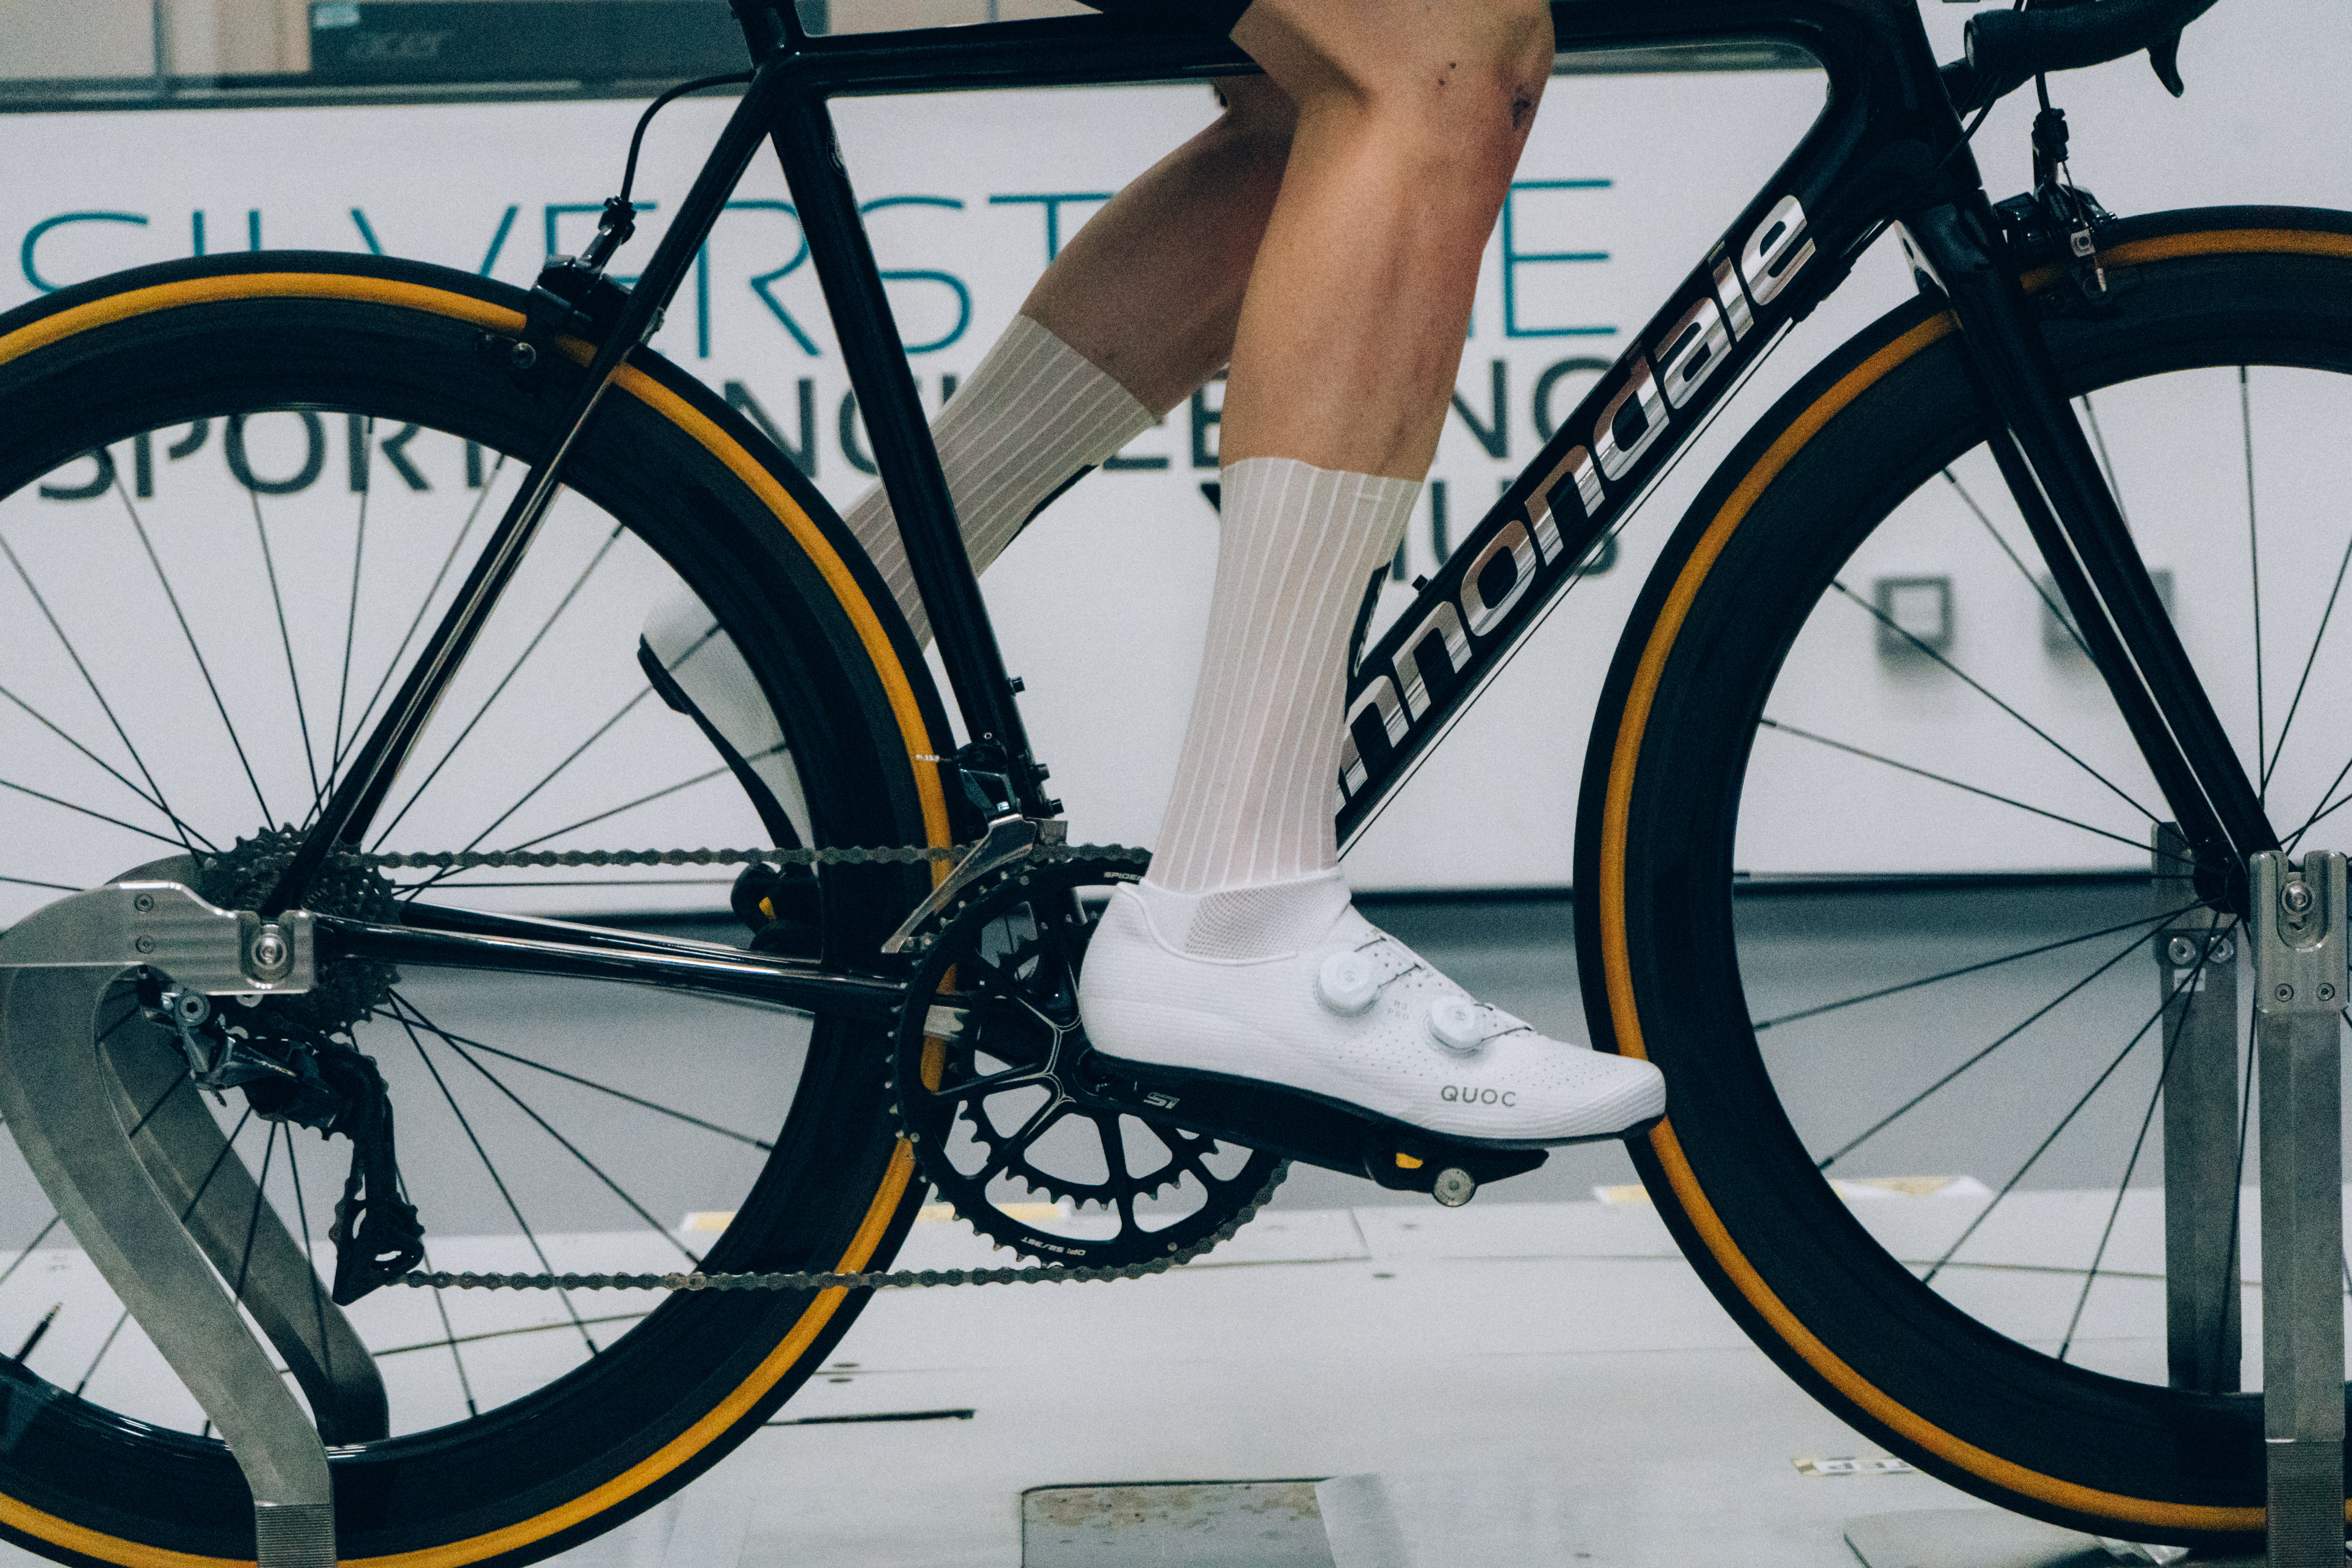
Average Weighted CdA: 0.3478M²
Watts at 45km/h: 407.61
Speed at 250 watts: 38.233km/h
Distance gained vs baseline: -167.7m
Time to cover 40km: 01h 02m 46s
Time saved vs slowest: 6s
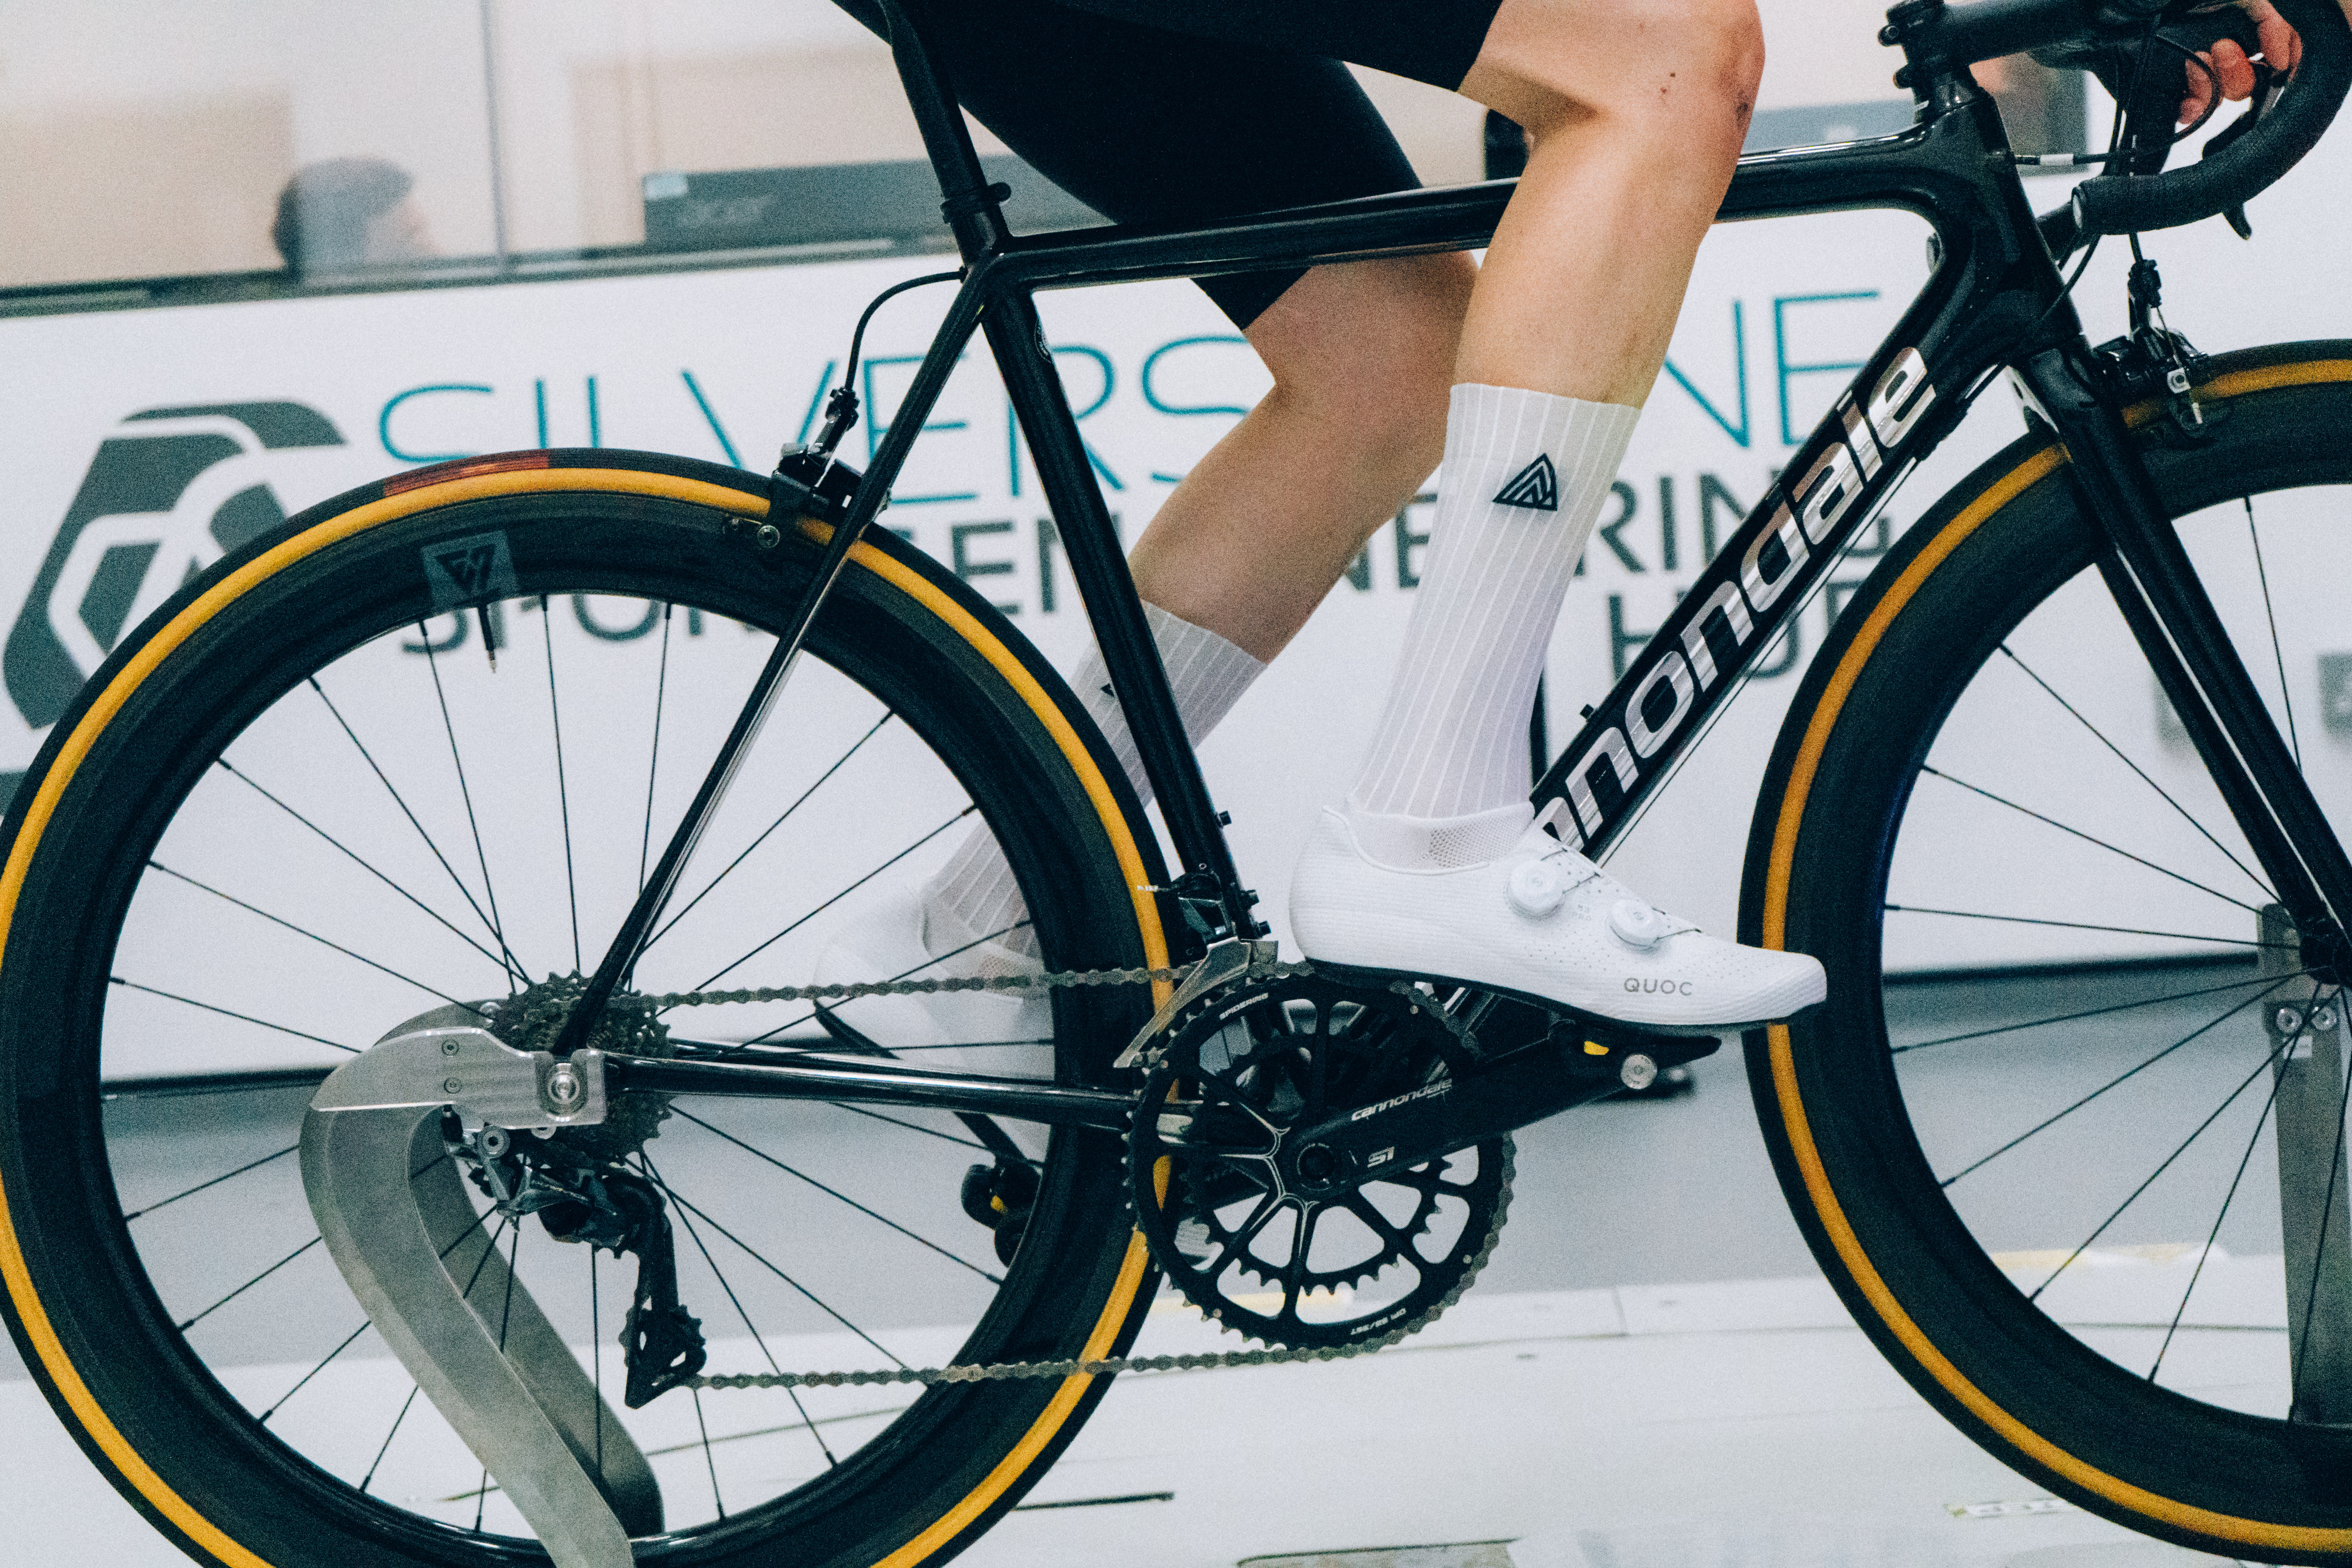
Average Weighted CdA: 0.3441M²
Watts at 45km/h: 403.27
Speed at 250 watts: 38.370km/h
Distance gained vs baseline: -31.0m
Time to cover 40km: 01h 02m 33s
Time saved vs slowest: 20s
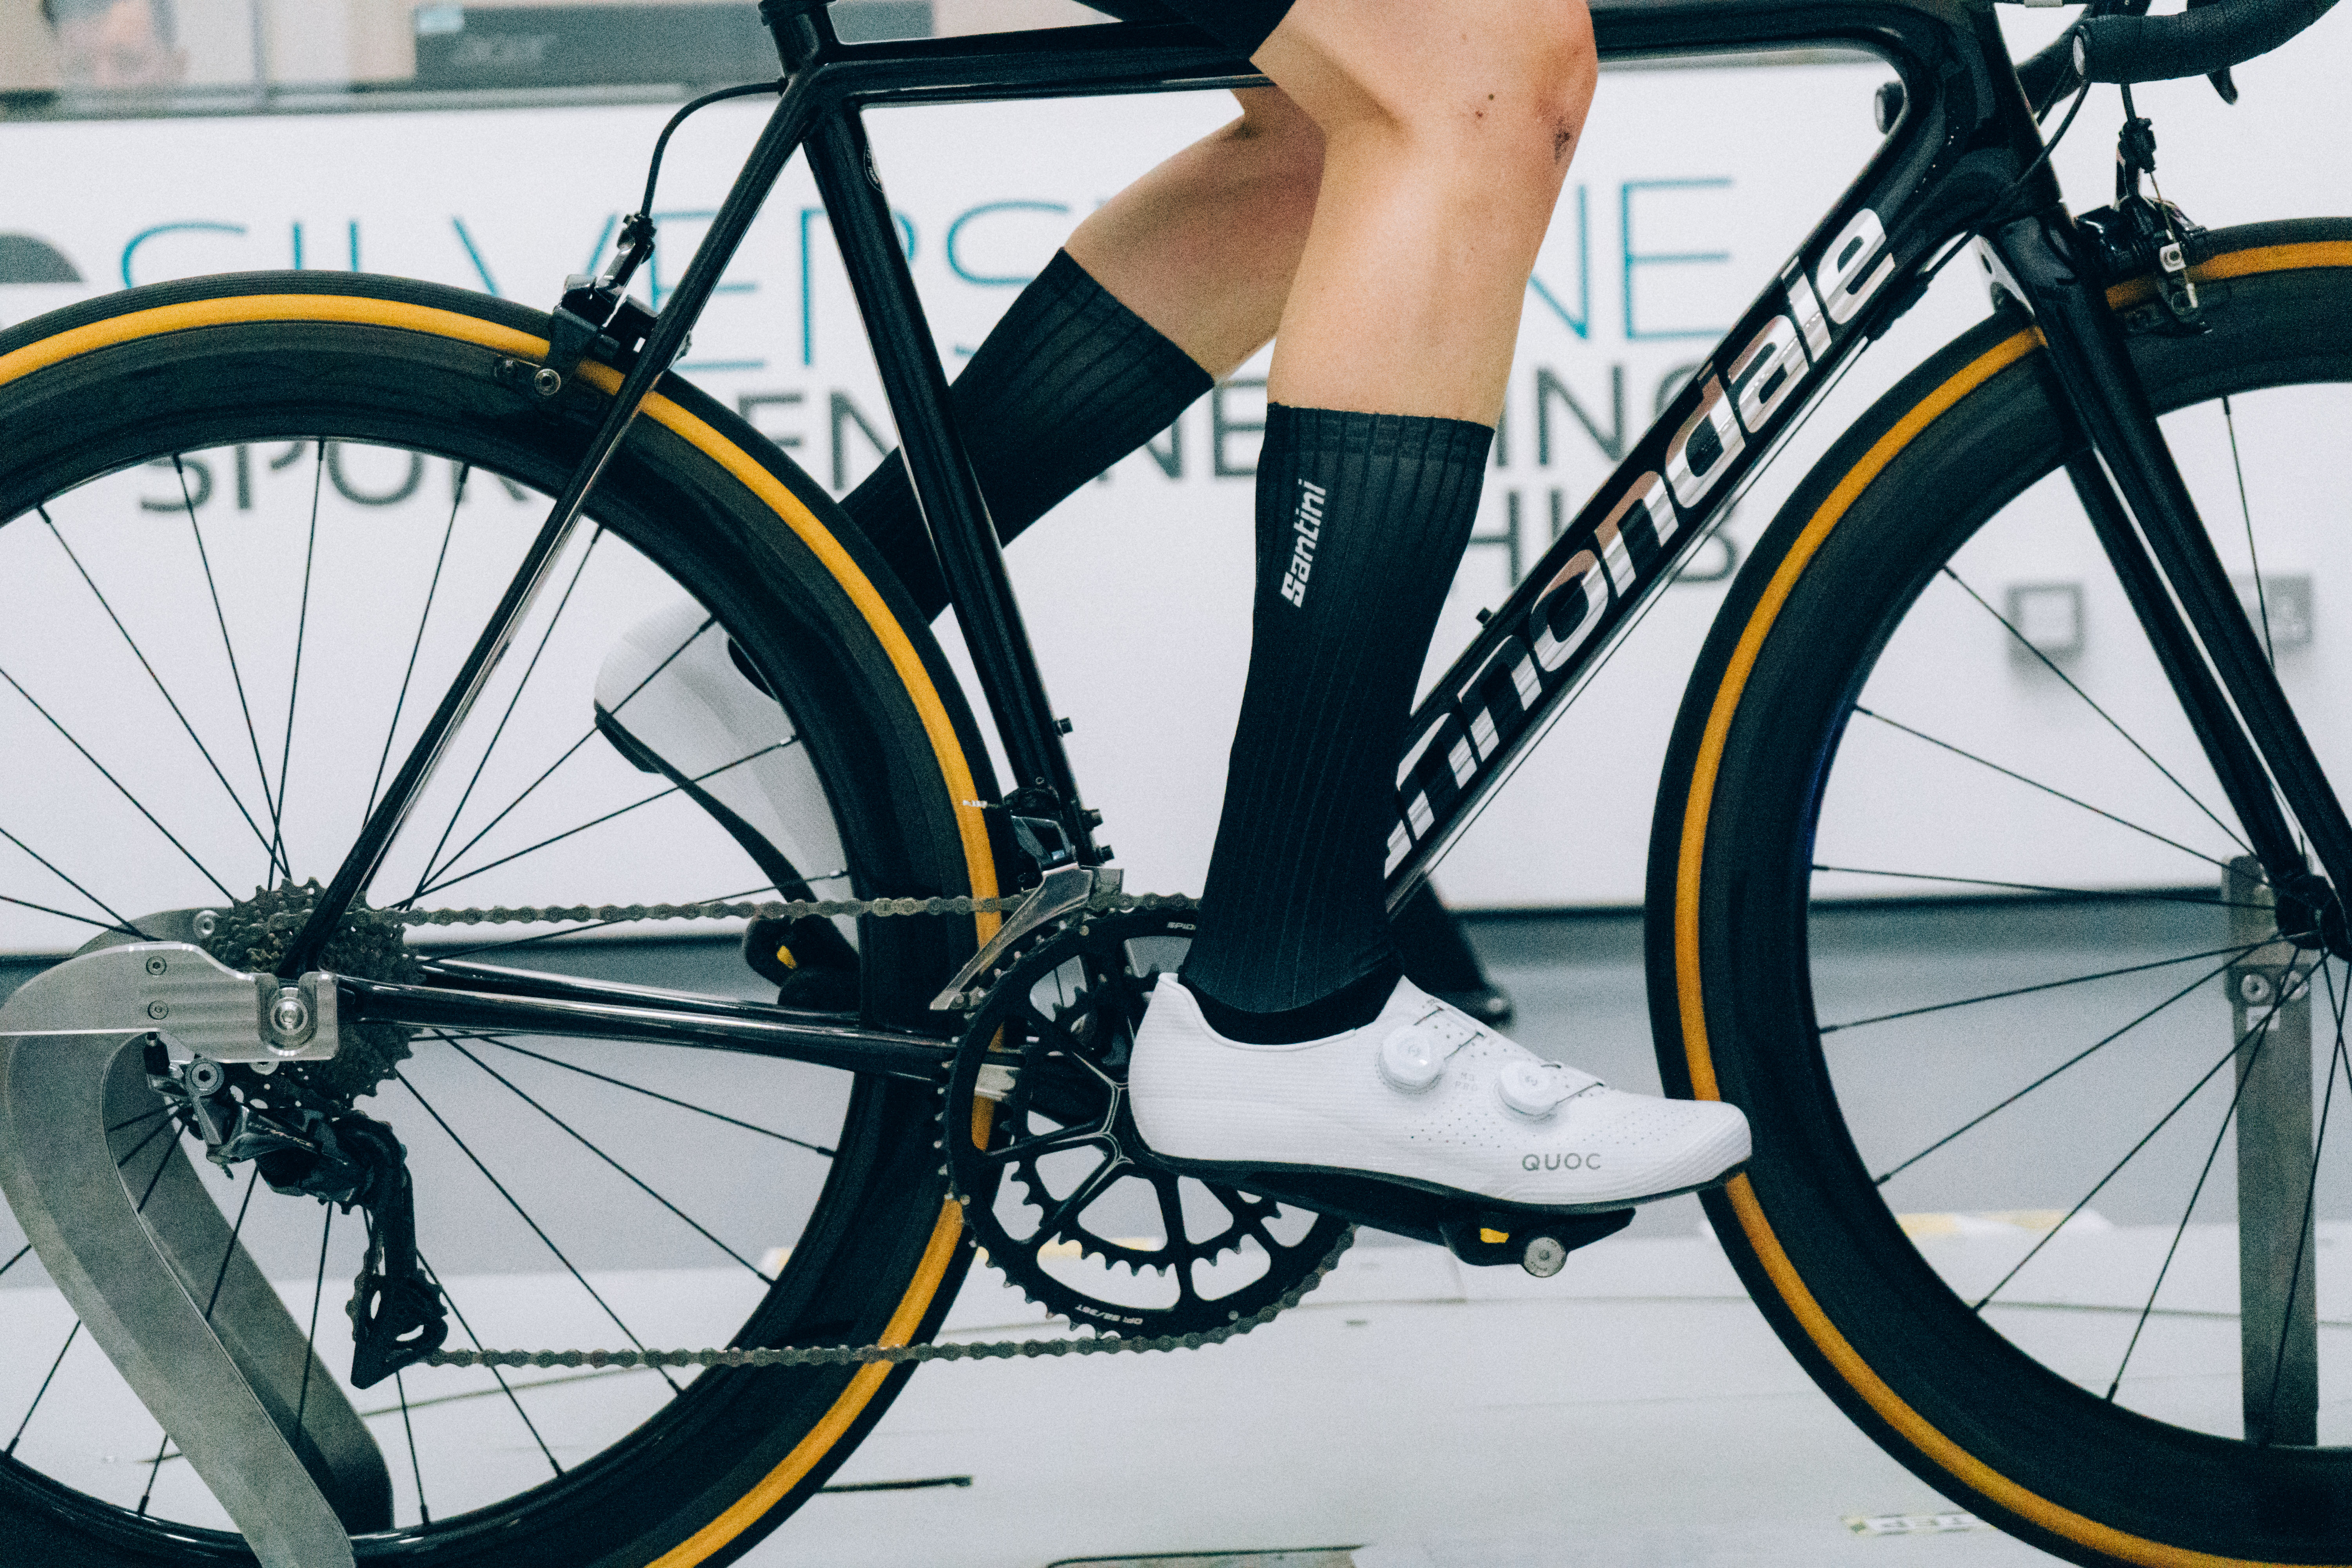
Average Weighted CdA: 0.3434M²
Watts at 45km/h: 402.43
Speed at 250 watts: 38.397km/h
Distance gained vs baseline: -4.1m
Time to cover 40km: 01h 02m 30s
Time saved vs slowest: 22s
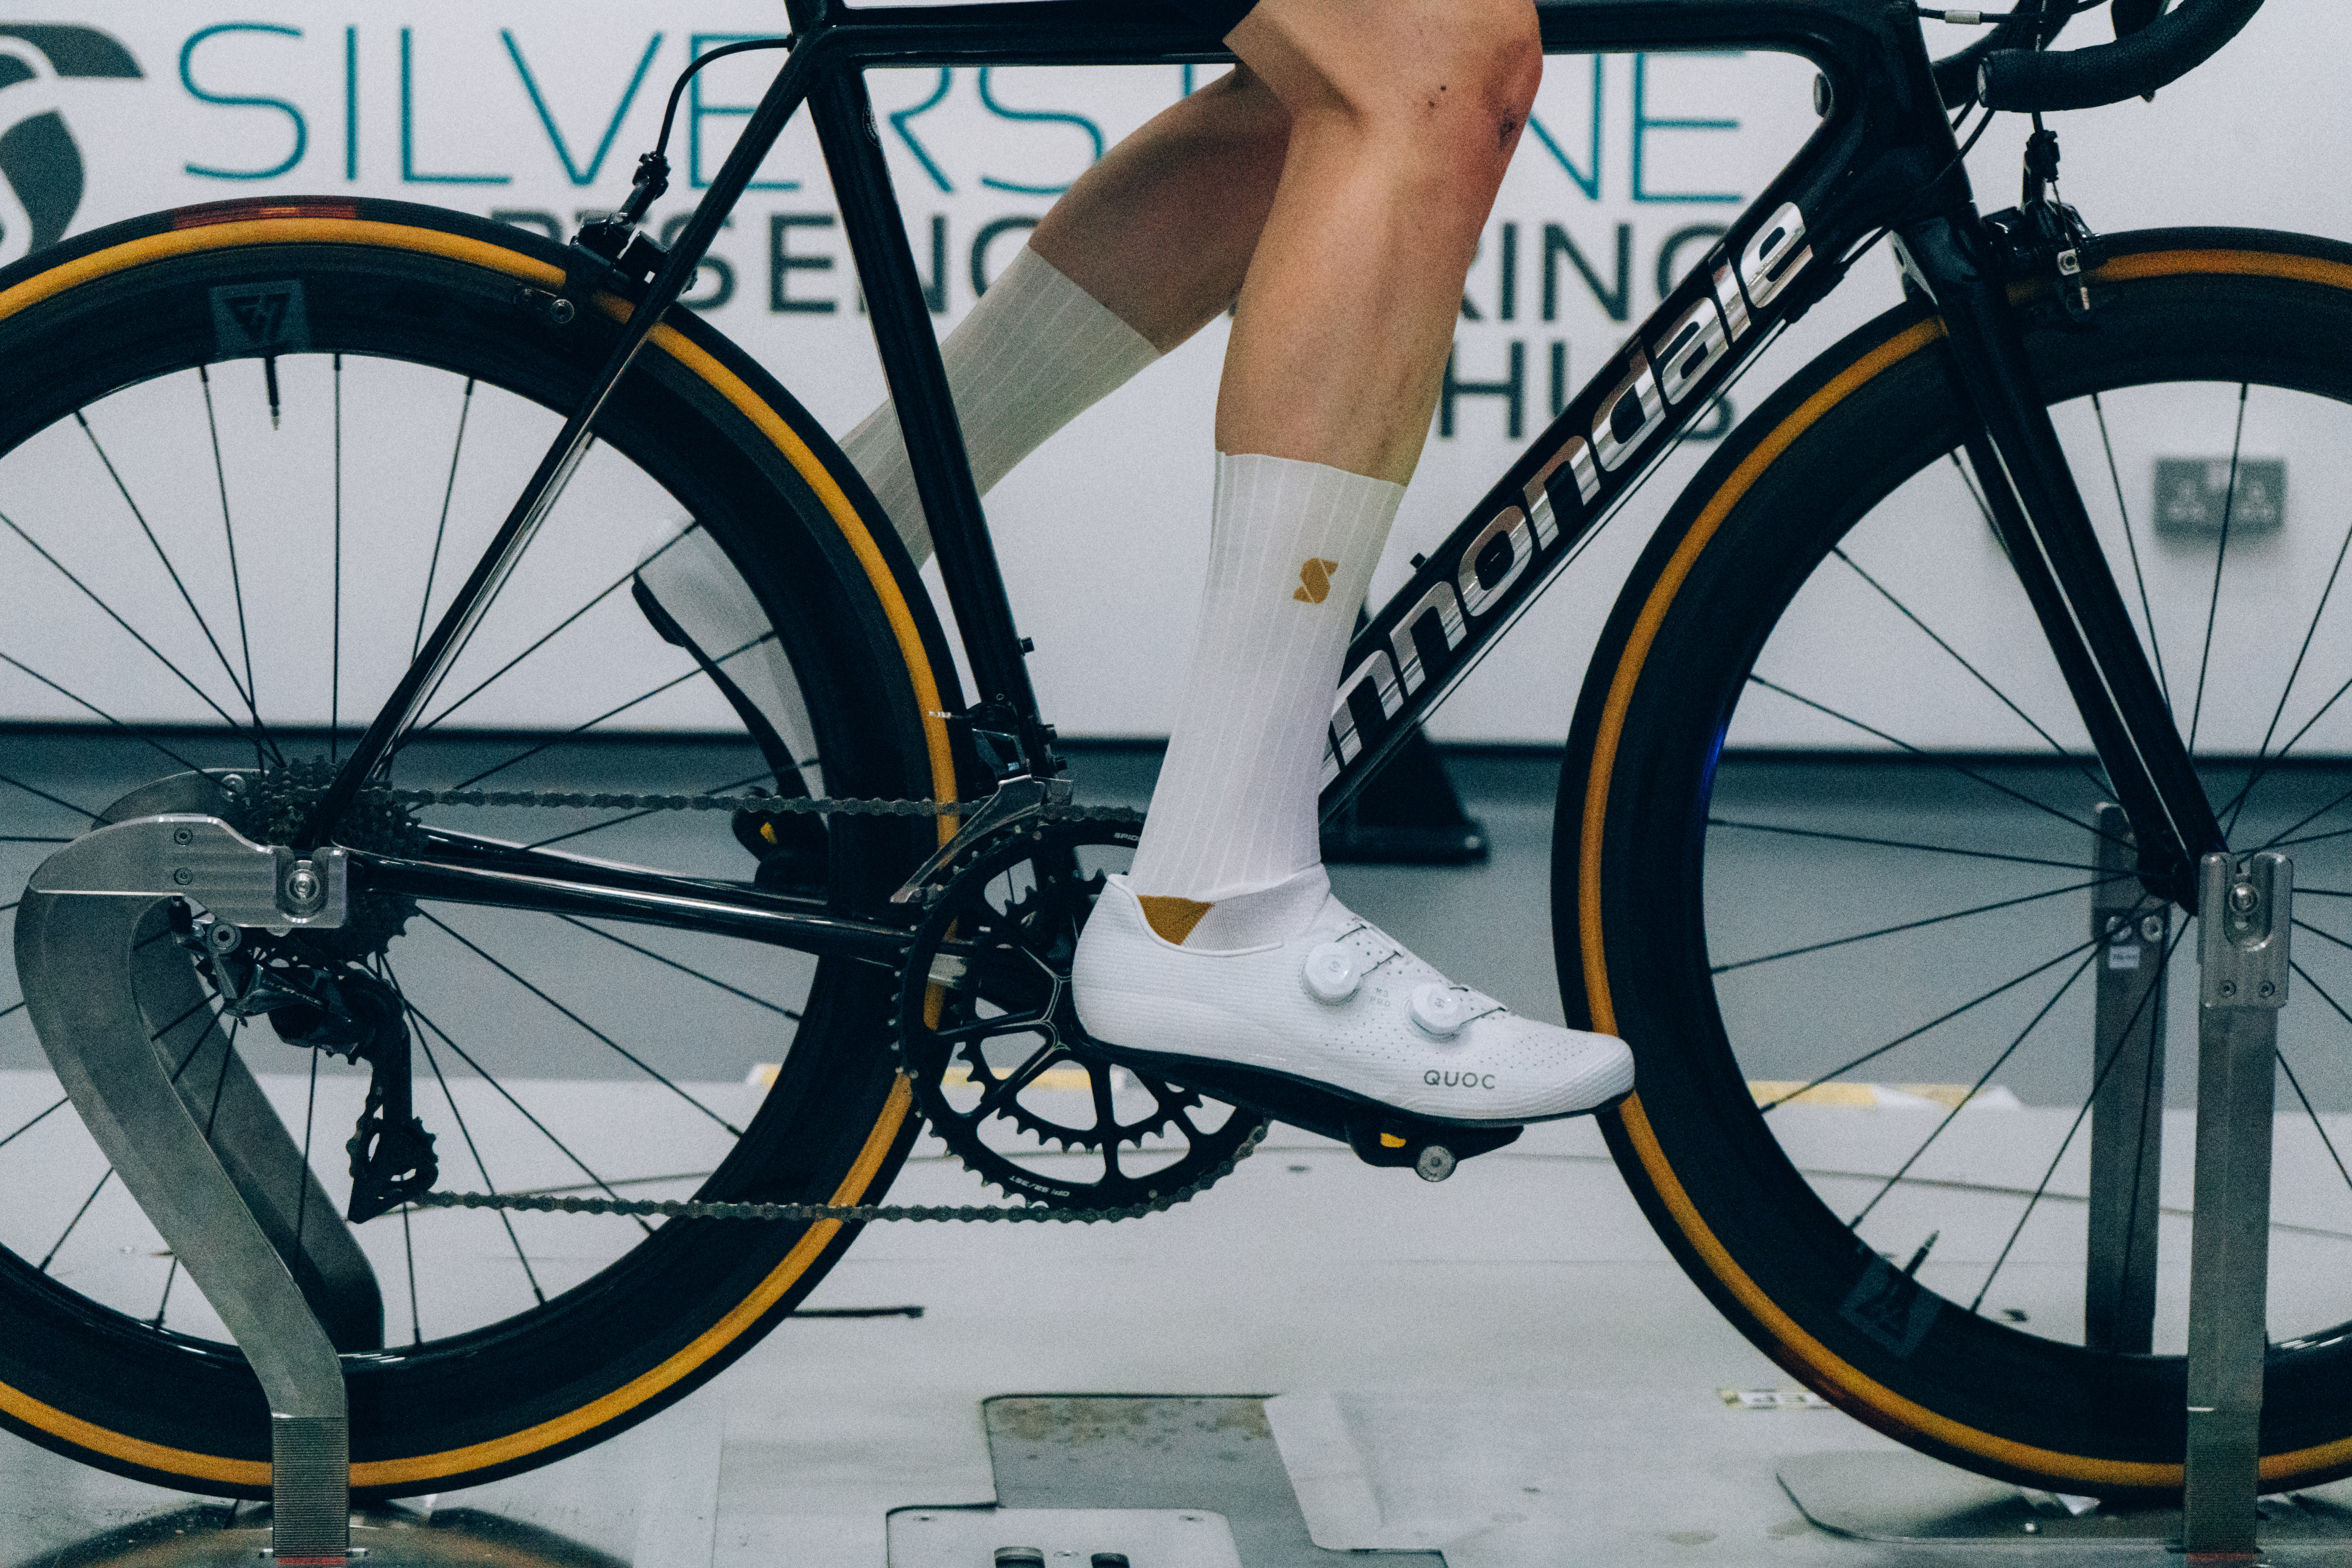
Average Weighted CdA: 0.3481M²
Watts at 45km/h: 407.89
Speed at 250 watts: 38.225km/h
Distance gained vs baseline: -176.2m
Time to cover 40km: 01h 02m 47s
Time saved vs slowest: 5s
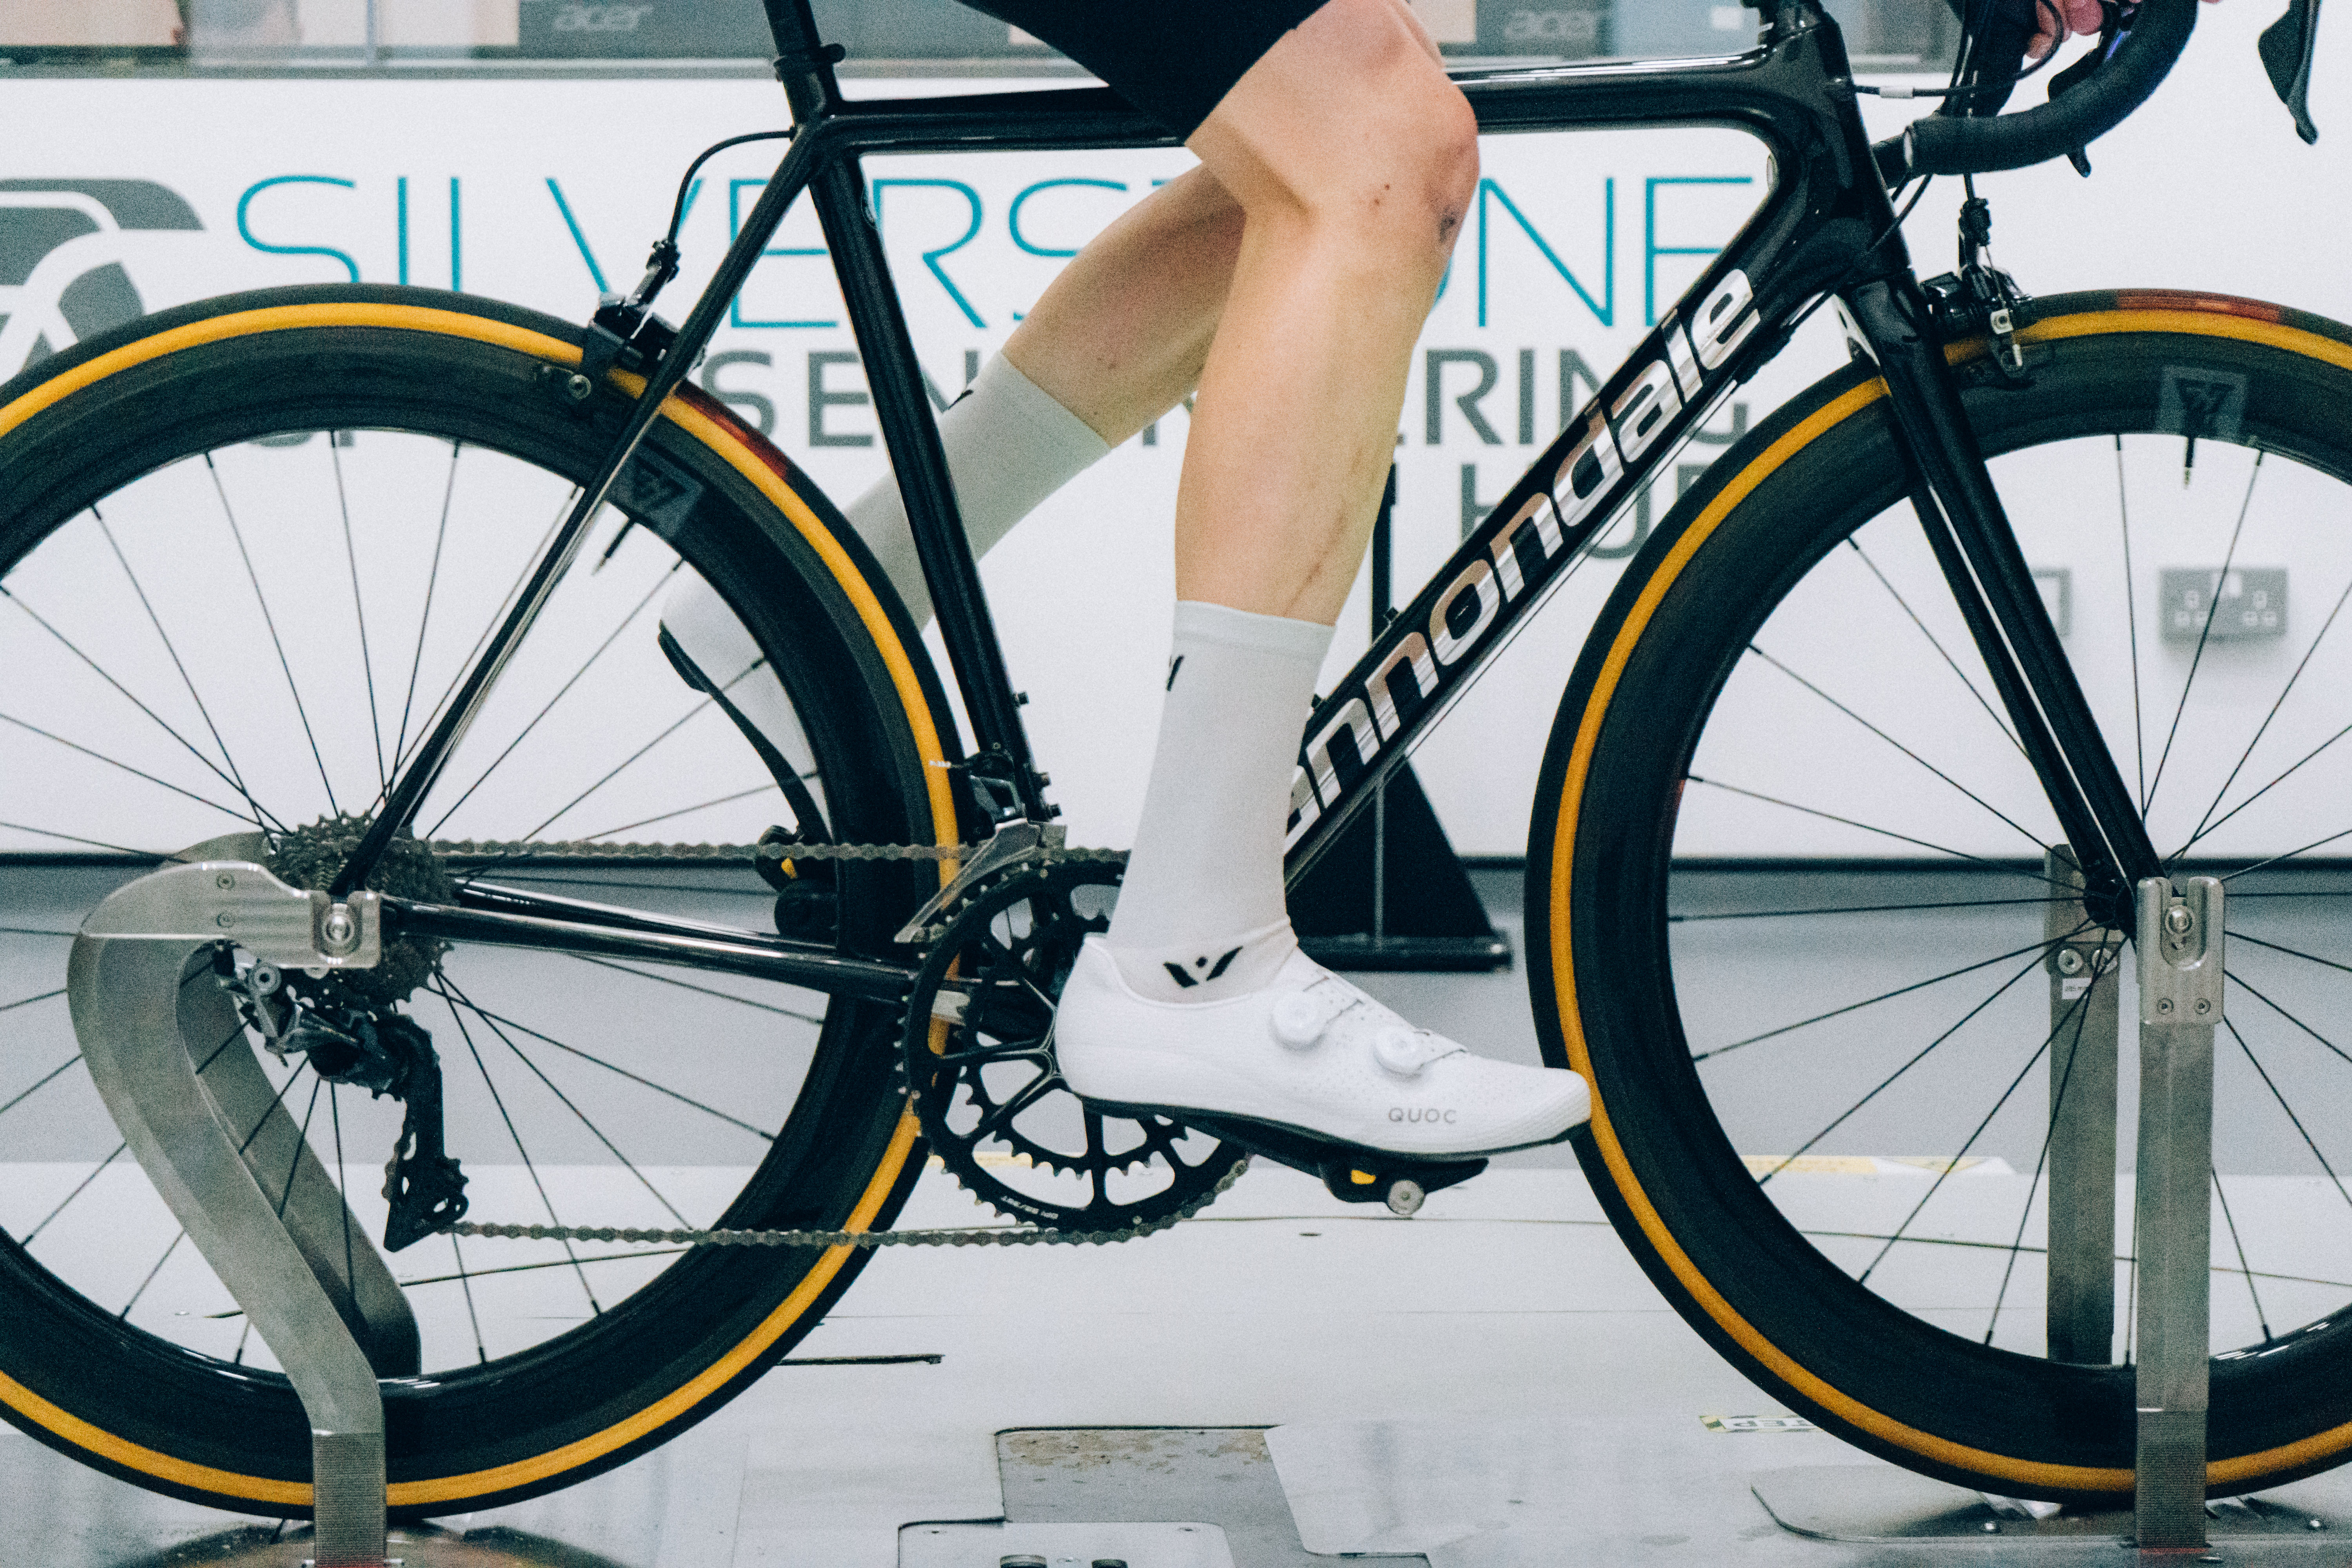
Average Weighted CdA: 0.3458M²
Watts at 45km/h: 405.27
Speed at 250 watts: 38.307km/h
Distance gained vs baseline: -94.1m
Time to cover 40km: 01h 02m 39s
Time saved vs slowest: 14
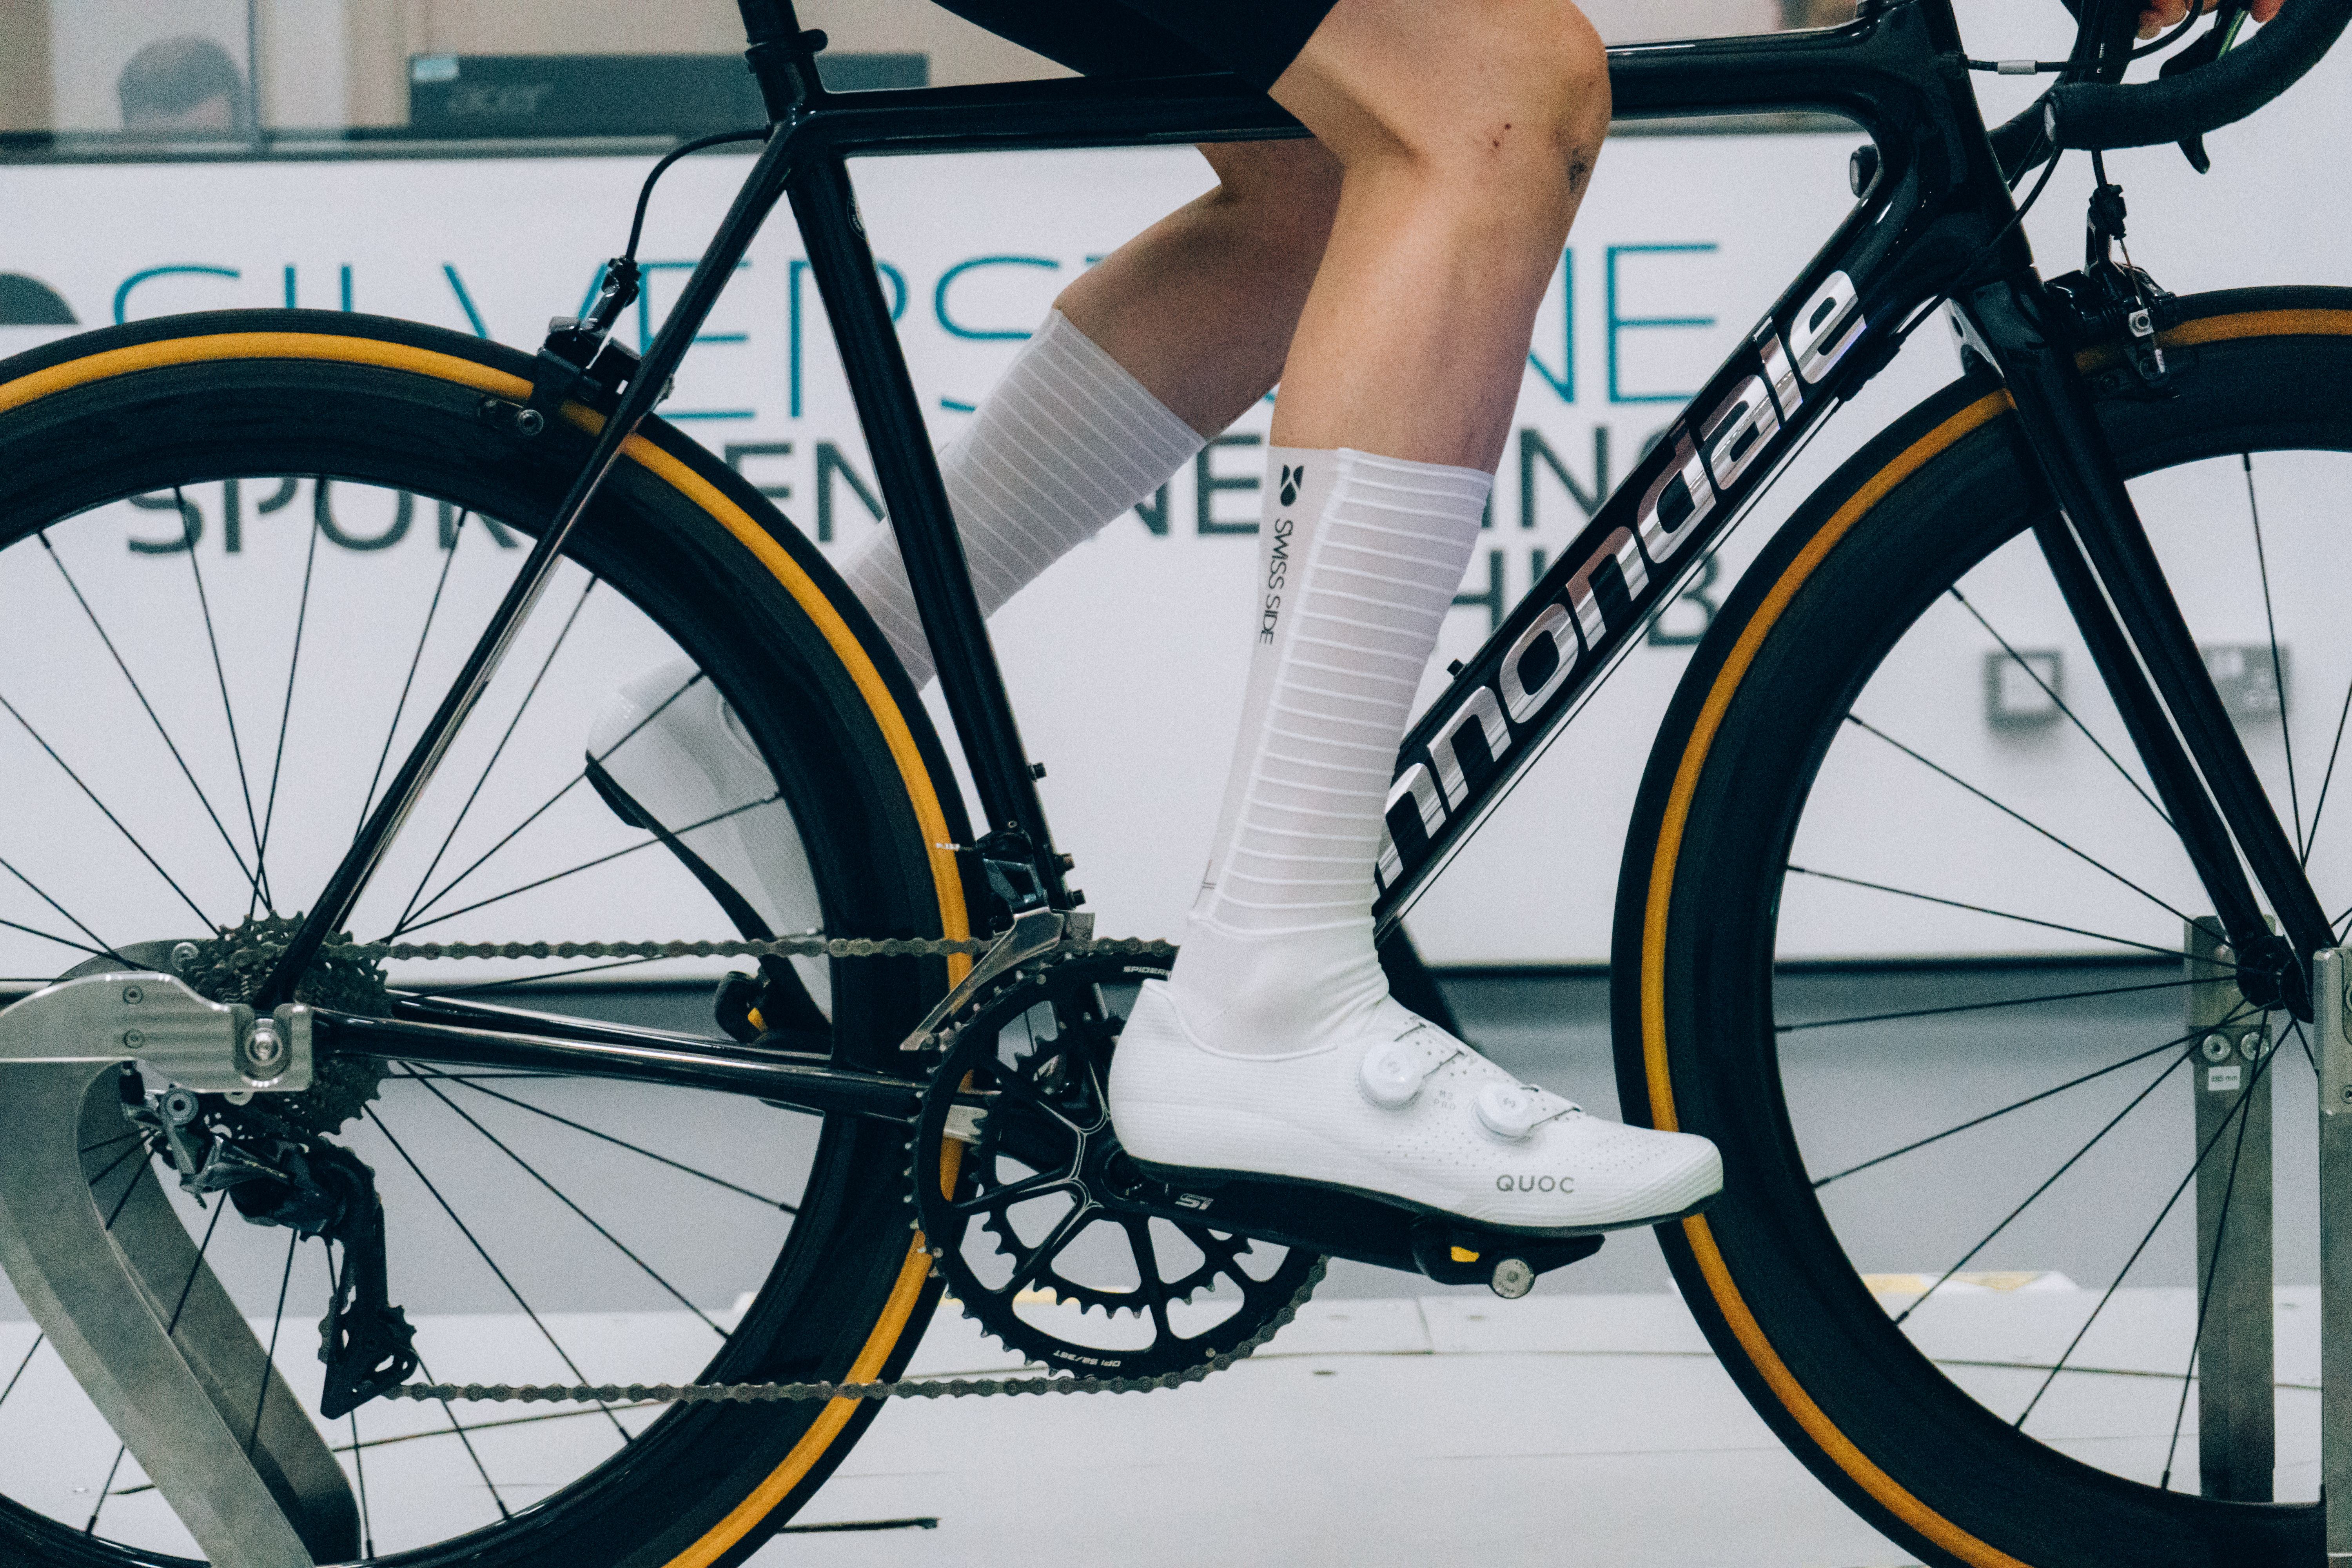
Average Weighted CdA: 0.3456M²
Watts at 45km/h: 404.99
Speed at 250 watts: 38.316km/h
Distance gained vs baseline: -85.2m
Time to cover 40km: 01h 02m 38s
Time saved vs slowest: 14s
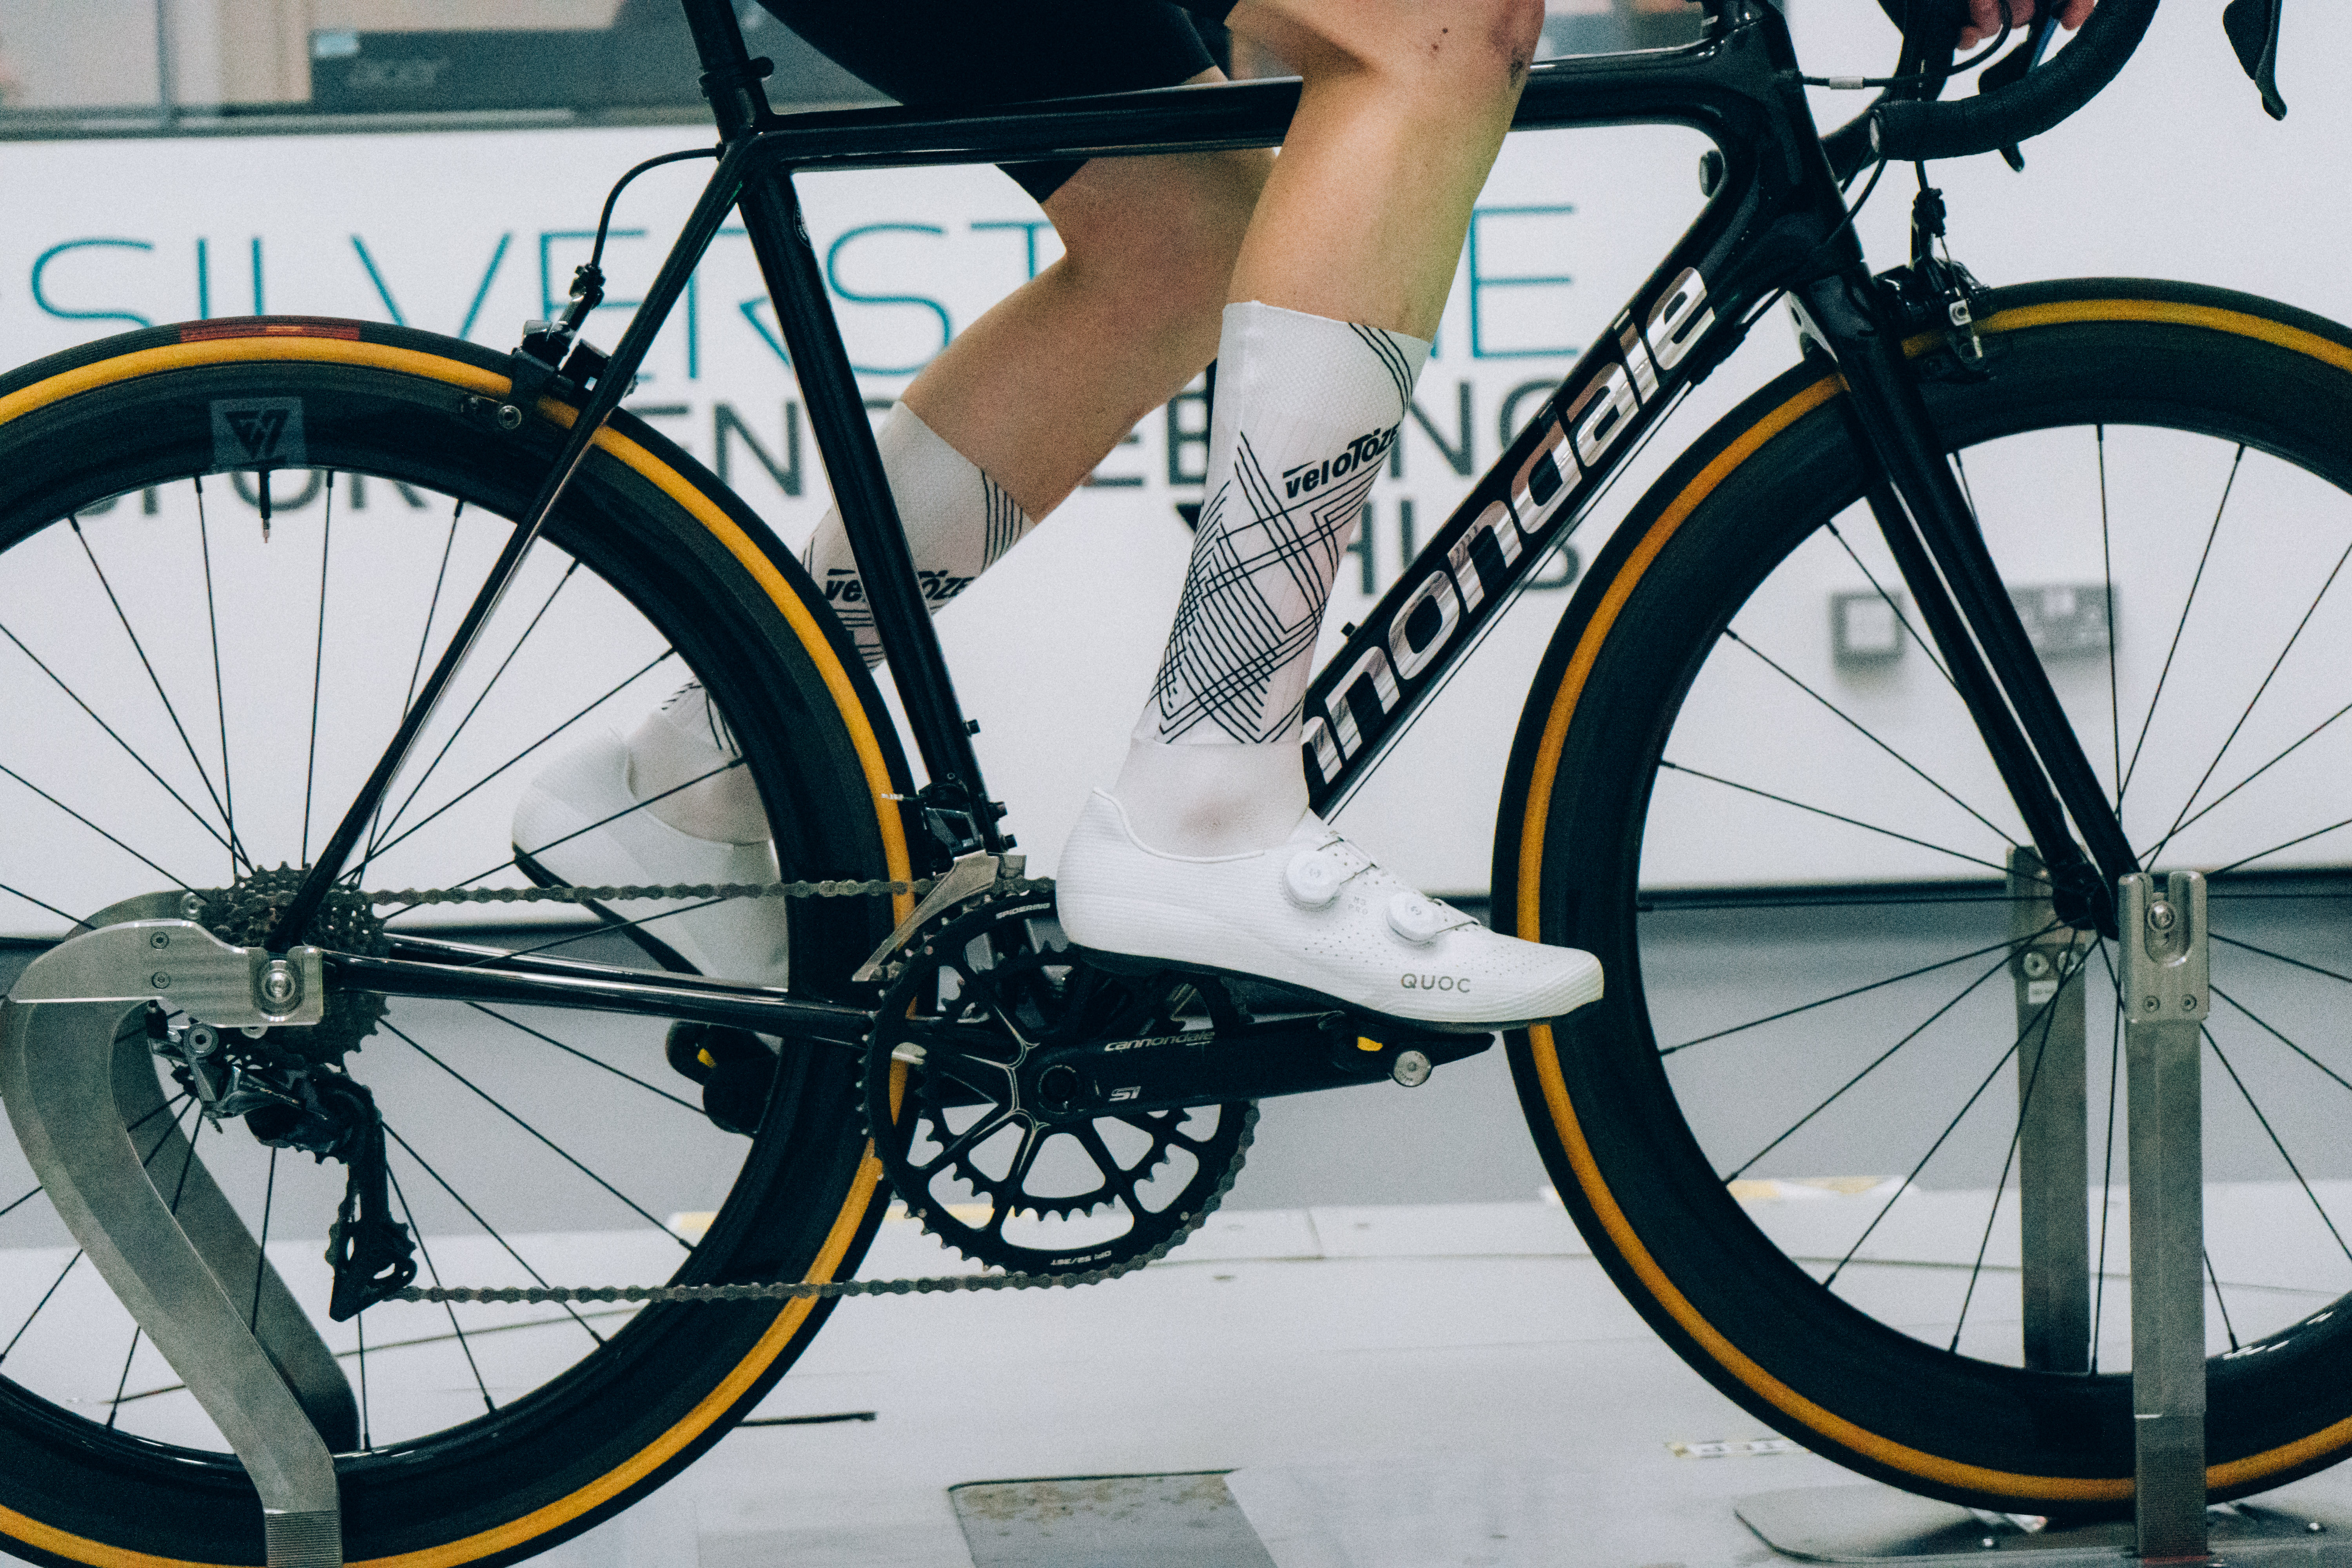
Average Weighted CdA: 0.3450M²
Watts at 45km/h: 404.28
Speed at 250 watts: 38.338km/h
Distance gained vs baseline: -63.0m
Time to cover 40km: 01h 02m 36s
Time saved vs slowest: 17s
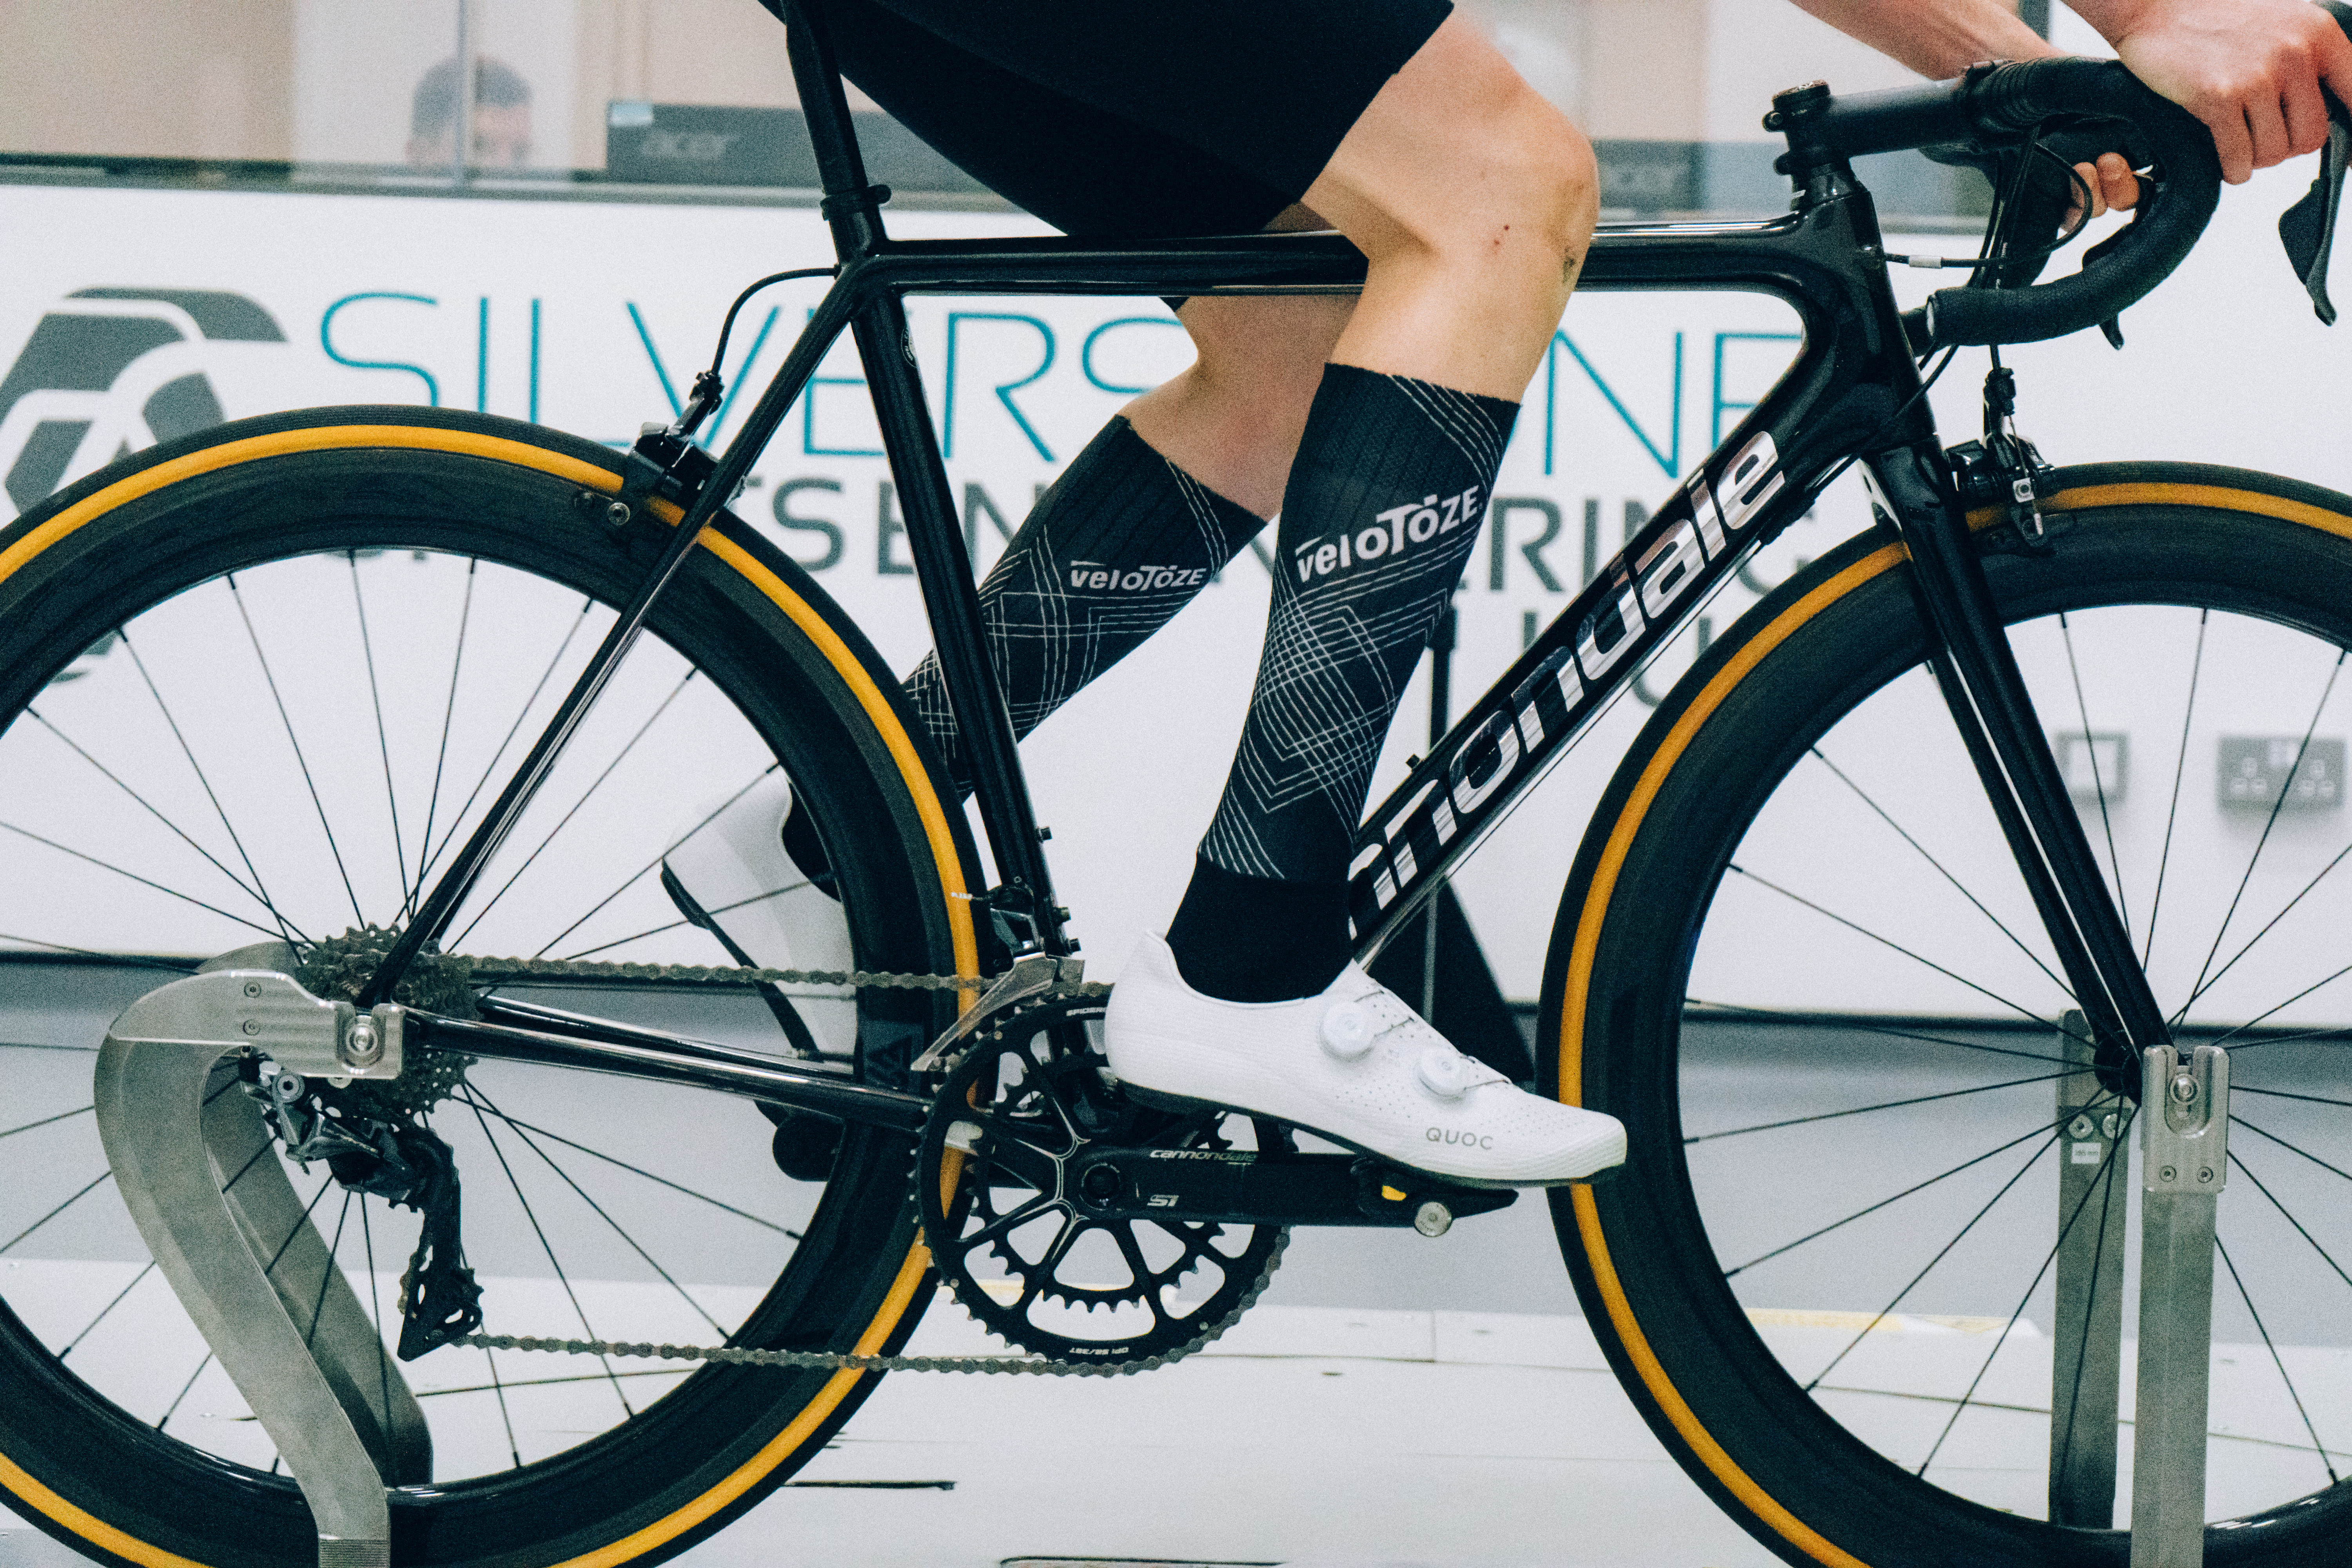
Average Weighted CdA: 0.3435M²
Watts at 45km/h: 402.56
Speed at 250 watts: 38.393km/h
Distance gained vs baseline: -8.3m
Time to cover 40km: 01h 02m 31s
Time saved vs slowest: 22s
Now let's graph out all that data to see the results more clearly.
Here we can see that the error margin (in green) is pretty big compared to the differences between each product. This means a lot of the products in the middle of the test are within the margin of error of all other products. We can confidently say, however, that the socks that tested fastest, including the Capo Super Corsa and the Assos RSR S11, are faster than the Castelli and the Huub models.
The biggest surprise of all, however, is that fifth in the test was the baseline Bontrager socks, which feature no aerodynamic properties at all, and that the 'No Socks' was a perfect mid-table score.
This suggests that Tom's legs are already pretty aerodynamic, and aren't massively benefited by the aero materials offered by the socks.
This is a similar graph to the one above, both visually and regarding the product order, but instead of showing CdA, it shows watts required to pedal at 45km/h, a metric people are more likely to be able to comprehend.
The graph above shows two metrics for each pair of socks. In green, you can see the expected speed when pedalling at 250 watts.
And in purple, the distance saved (or lost) against our baseline Bontrager socks. The bigger the better here, and a negative number shows products that tested worse than our baseline.
Caveats
As with all of our CN Labs projects, Cyclingnews does not claim that this data is the final word on the aerodynamic performance of the items included, but rather an additional stream of independent, unbiased testing and information to help our members make better-informed buying decisions.
The results are simply representative of our day of testing. We hope that being clear about our method and our protocol allows readers to appreciate the data while also understanding the bigger picture of where it may or may not apply to them.
Our testing shows that aero socks make very little difference on our tested rider, Tom. It's well known that the aero performance of cycling clothing can differ depending on the person wearing it, and in this case, the differences between no socks, standard socks and aero socks were minimal.
We were still able to identify differences between the aero socks, not forgetting the error margin, and different riders may see bigger wattage savings from sock to sock.
When making calculations for speed (and in turn, time to complete a distance), we aren't accounting for gradients, corners, drivetrain loss or any other variable. We're looking for the difference between each product here, not an absolute forecast.
This test was not sponsored and featured no product placement. We paid for the wind tunnel hire at the normal rate, and this test, like all of our CN Labs projects, is made possible solely and entirely by the paying Cyclingnews subscribers. Without your support, these tests wouldn't happen, so thank you.
Conclusions
This is perhaps the most difficult of our labs tests to draw conclusions from, as our testing didn't simply reaffirm the assumptions we already had.
We expected the Bontrager socks to be slowest by a mile, then for the aero socks all to sit in a league above, all within a few watts of one another, but that's not how things panned out.
At first, I wondered if the test was a waste of time. Was the margin of error simply too big for the small differences we were trying to find? Perhaps a little, but I think we can still draw a few valuable conclusions.
I won't lie, it even crossed my mind whether aero socks were in fact just a gimmick. But we previously tested standard socks, aero socks and no socks and found a small but noticeable difference. I'm also never going to try and argue with Bigham, Dowsett, Jasper Ockeloen, and the hundreds of experts out there, much cleverer than me, who have found a significant difference with different protocols.
One fair conclusion to draw, in my opinion, is that aero socks aren't the immediate free-speed-for-everyone upgrade that we might be led to believe.
In Tom's case, I'm sure he won't mind me saying he's quite a small guy, and his calves are proportionately small too. They're also probably a good aerodynamic shape, and with shaved legs, the drag coefficient is probably pretty good. The trip strip material added to most aero socks is designed to help airflow, but for Tom, it's quite clear the air didn't need much help.
Someone with bigger or differently shaped calves might benefit more. Without testing a dozen different people, it's hard to say for sure.
What's interesting, though, is that in speaking to Tom after the testing, we both agreed the placebo effect can't be ignored. Before we ran our tests, he said he would turn up to a race with aero socks on, thinking, optimistically, he's got 7-10 watts on the guy next to him, just because of the socks.
The reality is that those 7-10 watts could just as easily be nothing, but we'll both continue to wear them. I'd rather know there's a chance I'm saving some energy, rather than feel like the guy next to me on the start line has the advantage.
What this means for our readers' buying decisions is that realistically, unless you head to a wind tunnel yourself, you probably won't know for sure whether aero socks work for you or not, and more pertinently, whether an expensive pair will be faster than a cheap pair.
So pick a pair that you feel confident will stay up and stay comfortable, will wash well, and won't rip at the first sight of a fingernail. With all that sorted, pick a pair that doesn't cost too much, and that you feel will make your competitors nervous on the start line.

Josh is Associate Editor of Cyclingnews – leading our content on the best bikes, kit and the latest breaking tech stories from the pro peloton. He has been with us since the summer of 2019 and throughout that time he's covered everything from buyer's guides and deals to the latest tech news and reviews.
On the bike, Josh has been riding and racing for over 15 years. He started out racing cross country in his teens back when 26-inch wheels and triple chainsets were still mainstream, but he found favour in road racing in his early 20s, racing at a local and national level for Somerset-based Team Tor 2000. These days he rides indoors for convenience and fitness, and outdoors for fun on road, gravel, 'cross and cross-country bikes, the latter usually with his two dogs in tow.
- Tom WieckowskiTech writer
- Will JonesSenior Tech Writer
You must confirm your public display name before commenting
Please logout and then login again, you will then be prompted to enter your display name.
